Docker构建日志收集平台EFK(TLS)
前言
如题, 主要记录一下之前搭建部署的一套日志收集系统。这里采用docker-compose的方式运行,还是那句话主要是思路。
方式: 一台服务器上面利用docker-compose运行三个ES节点跟Kibana,并启用SSL,再使用Filebeat来收集服务器上面的应用日志到ES, 最后Kibana来做展示
配置
目录创建
1 | mkdir -p /data/{es/node-1/{data,certs,logs,config},plugins} |
部署文件
1 | version: "3" |
非SSL
elasticsearch.yaml配置文件
这里以node-1为例,其他不同的地方就是 node.name
1 | vim /data/es/node-1/config/elasticsearch.yml |
kibana.yaml
1 | vim /data/kibana/config/kibana.yml |
启动
1 | root@ip-10-10-10-29:/data# docker-compose up -d |
上面已经启动,如果有报错查看容器日志就行了,之前部署的时候报错内容还是很清晰
进入容器查看:
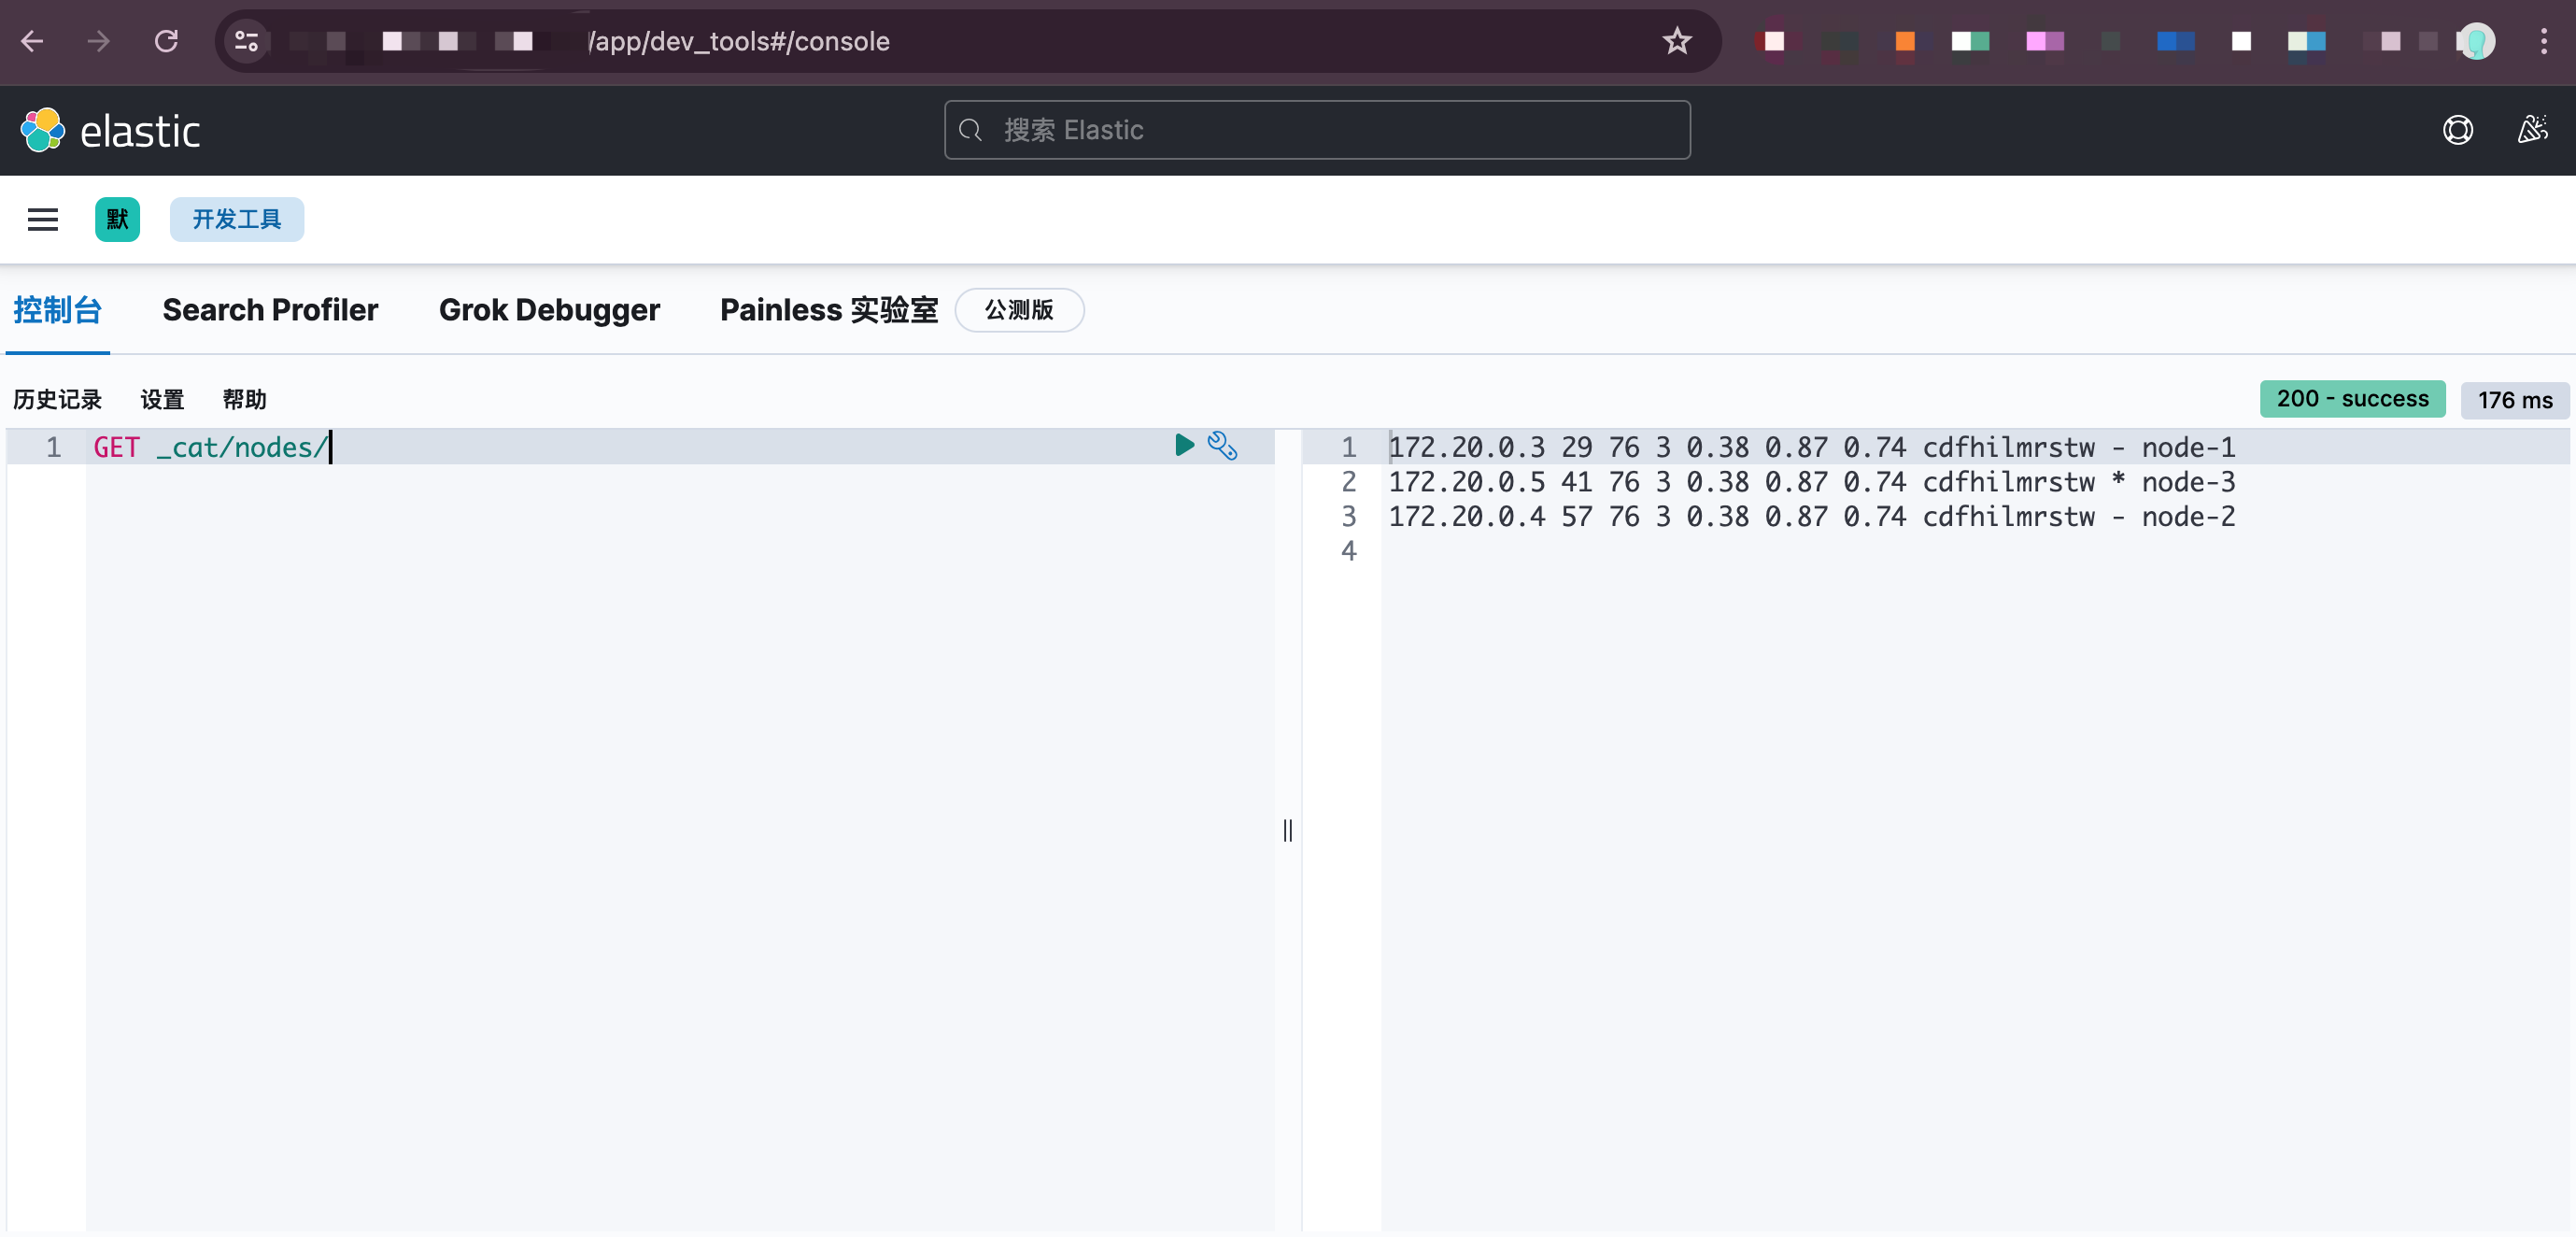
1 | root@node-1:/usr/share/elasticsearch# curl localhost:9200 |
以上说明ES集群已经正常工作,看一下通过nginx代理转发到kibana的结果
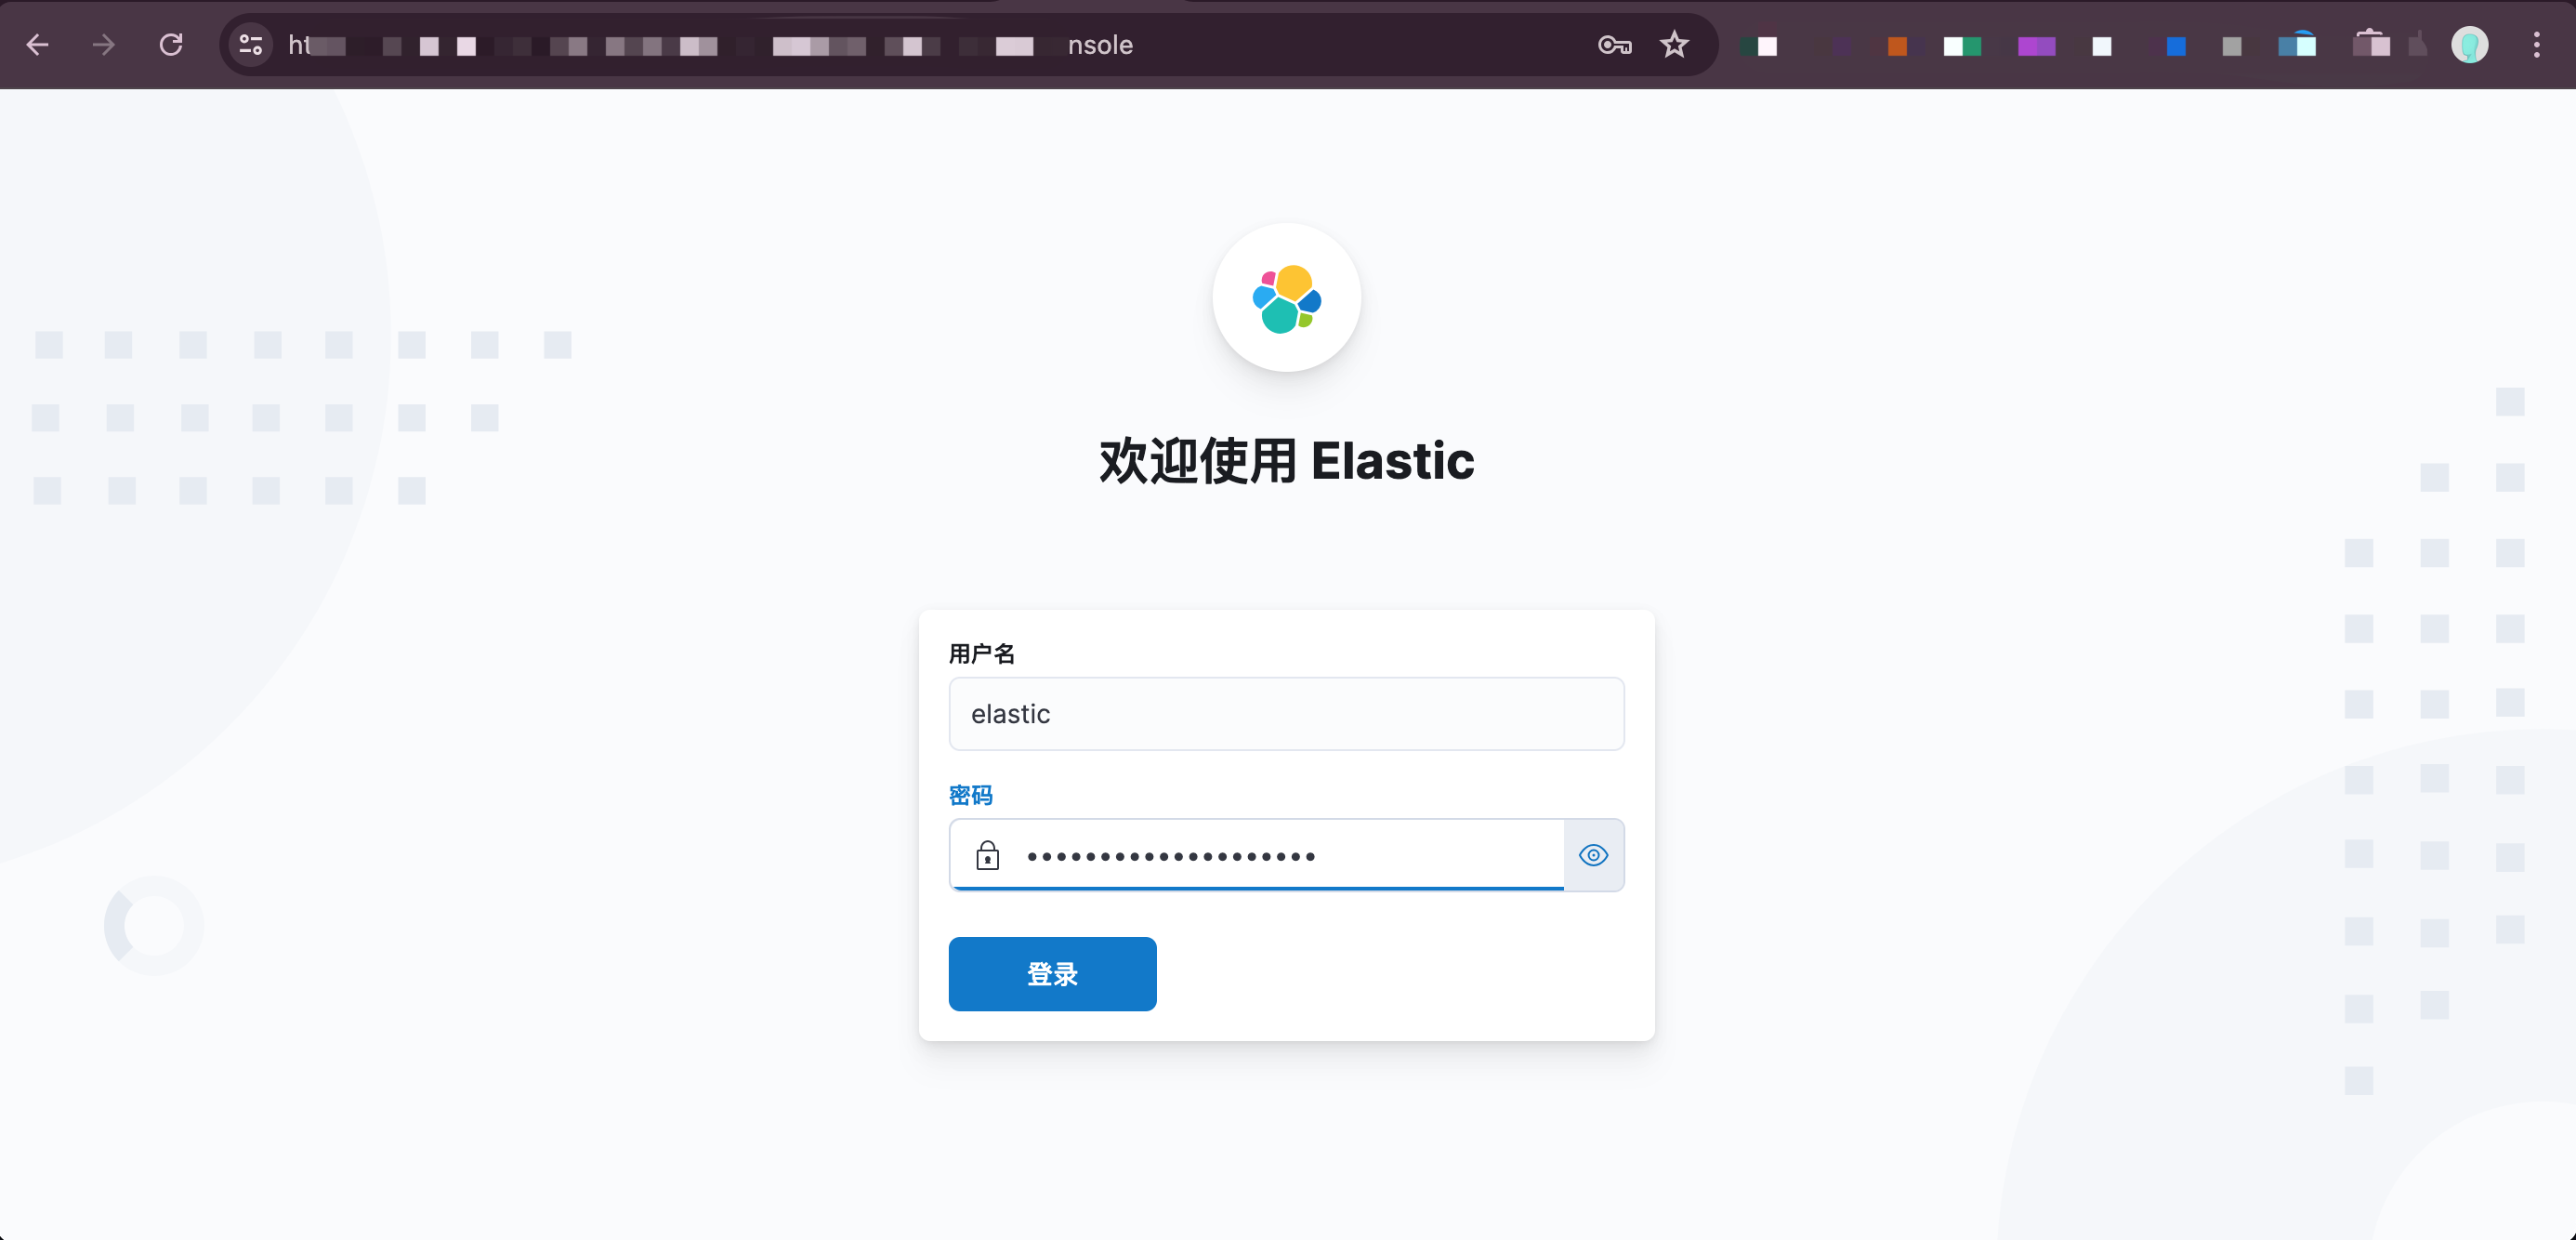
kibana也能正常工作,只是这里在访问的时候直接就进入了kibana,如果不加一个身份验证功能,这就等于裸奔,即便在放在内网也是极其不安全的,所以需要加一个身份验证。
SSL方式
利用自带的工具生成证书,也可以自行生成证书,但注意要限制域名和IP,否则在进行https通讯时会校验失败
进入node-1容器 ,操作
1 | root@ip-10-10-10-29:~# docker exec -it node-1 bash |
修改配置文件/data/es/node-1/config/elasticsearch.yml. 以节点node-1为例
1 | # 这里的内容同非ssl部署一样 |
每个节点都需修改后,重启一下es集群
重启完毕后,查看状态和日志,检查是否有异常
若无异常,可以开始设置密码, 进入容器 node-1
1 | root@ip-10-10-10-29:/data# docker exec -it node-1 bash |
使用 ES API 检查各个节点是否正常
1 | curl -k --user elastic:密码 -X GET "https://172.20.0.3:9200" --cert-type P12 --cert /usr/share/elasticsearch/config/certs/node.p12 |
此时ssl已配置完毕,配置kibana
1 | # 把之前放在node-1下面的证书复制到kibana/cert下面: |
修改配置文件kibana/config/kibana.yml
1 | server.host: 0.0.0.0 |
修改完毕后 ,重新部署一下 kibana服务即可
以上只要登录就可以使用了。
Filebeat 日志采集
这里我才用的方式是 docker运行 filebeat服务,然后将网关服务器的Nginx日志挂载进filebeat
1 | vim /opt/filbeat/docker-compose.yaml |
filebeat的配置文件在 /opt/filebeat/filebeat.yml
1 | vim /opt/filebeat/filebeat.yml |
配置完毕之后,查看日志是否异常,如果没有异常,到node-1上面通过ES API查询是否有index生成
1 | root@node-1:/usr/share/elasticsearch# curl -k --user elastic:xxxxxxxxxxxx -X GET "https://172.20.0.3:9200/_cat/indices " --cert-type P12 --cert /usr/share/elasticsearch/config/certs/node.p12 |
Kibana配置
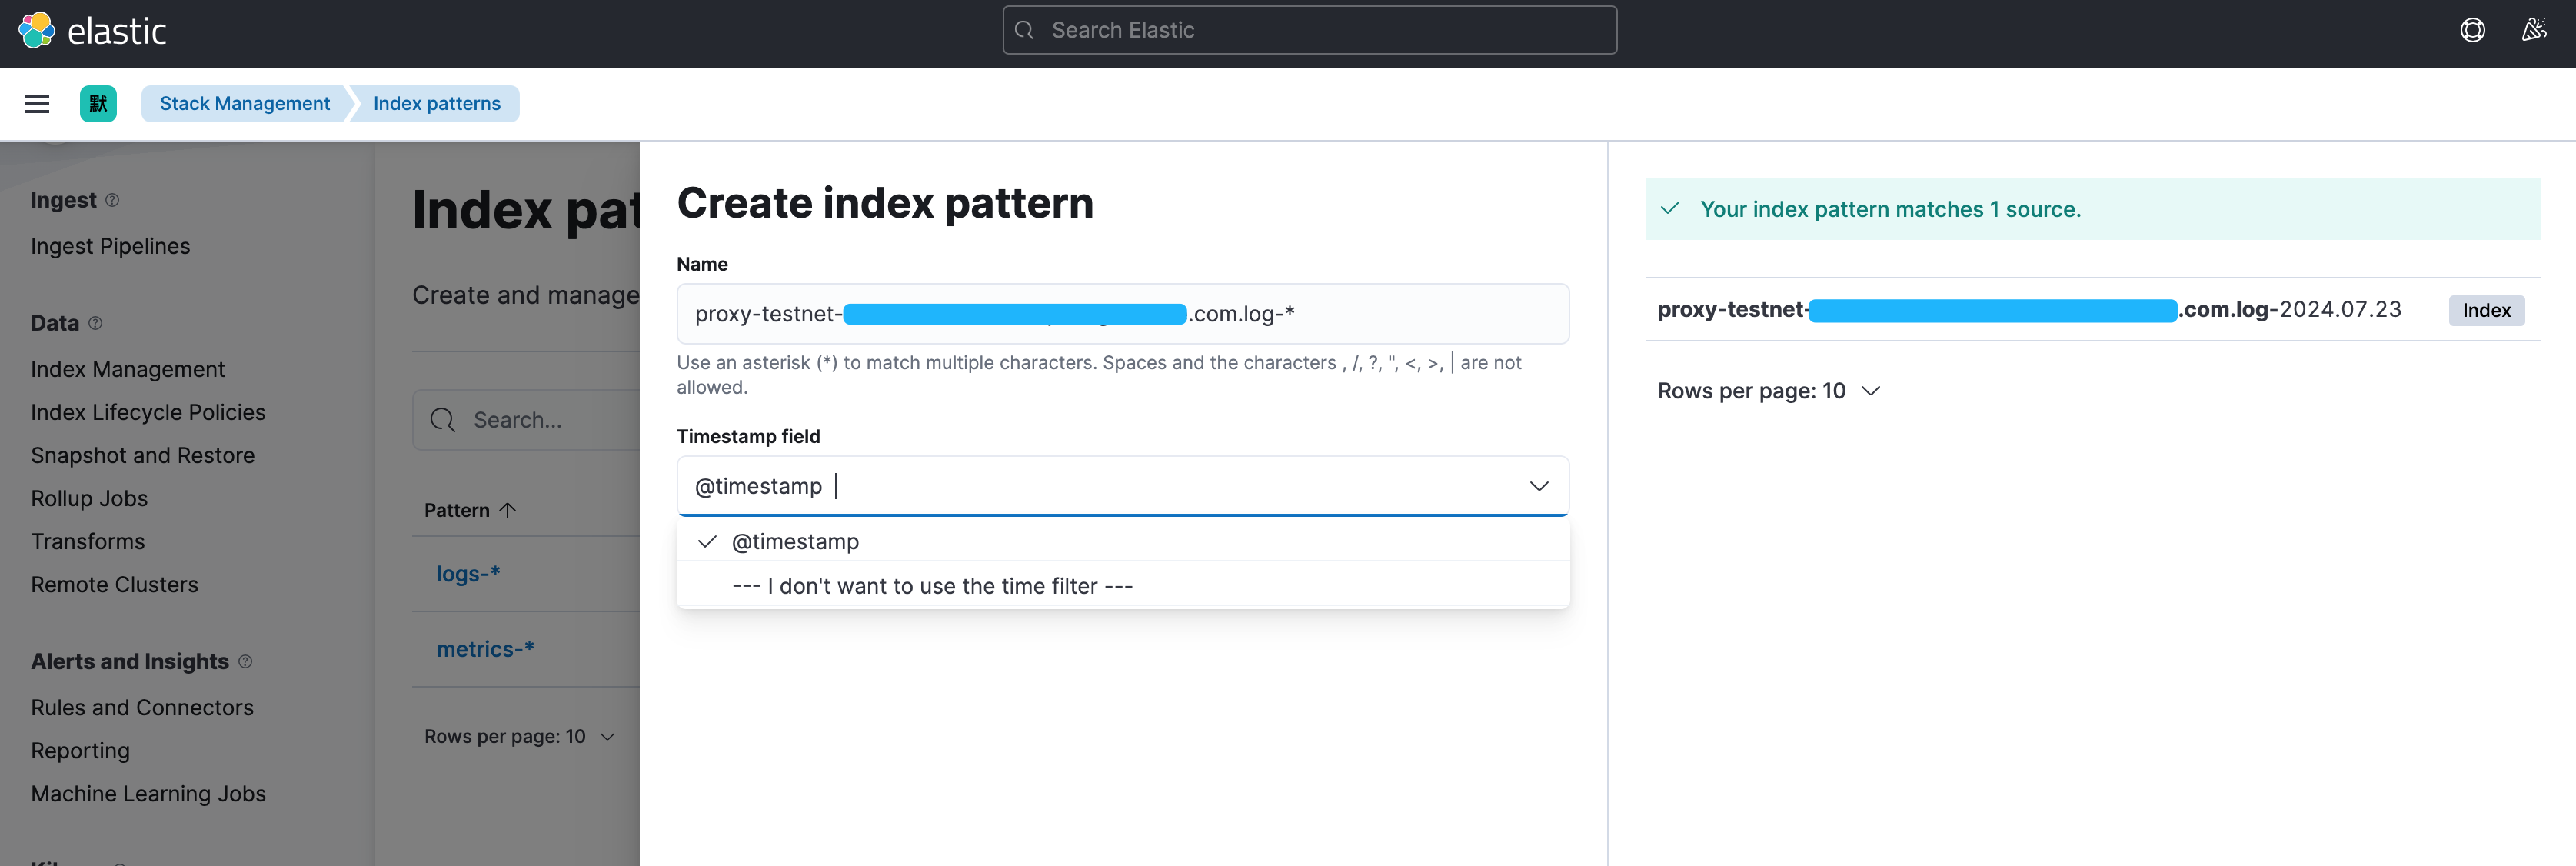
上面可以看到filebeat已经正常往ES写入数据,在kibana中配置一下:
Stack Manager - Index Patterns - Create index pattern
直接创建后菜单栏: Discover 选择刚刚创建的这个Index Pattern
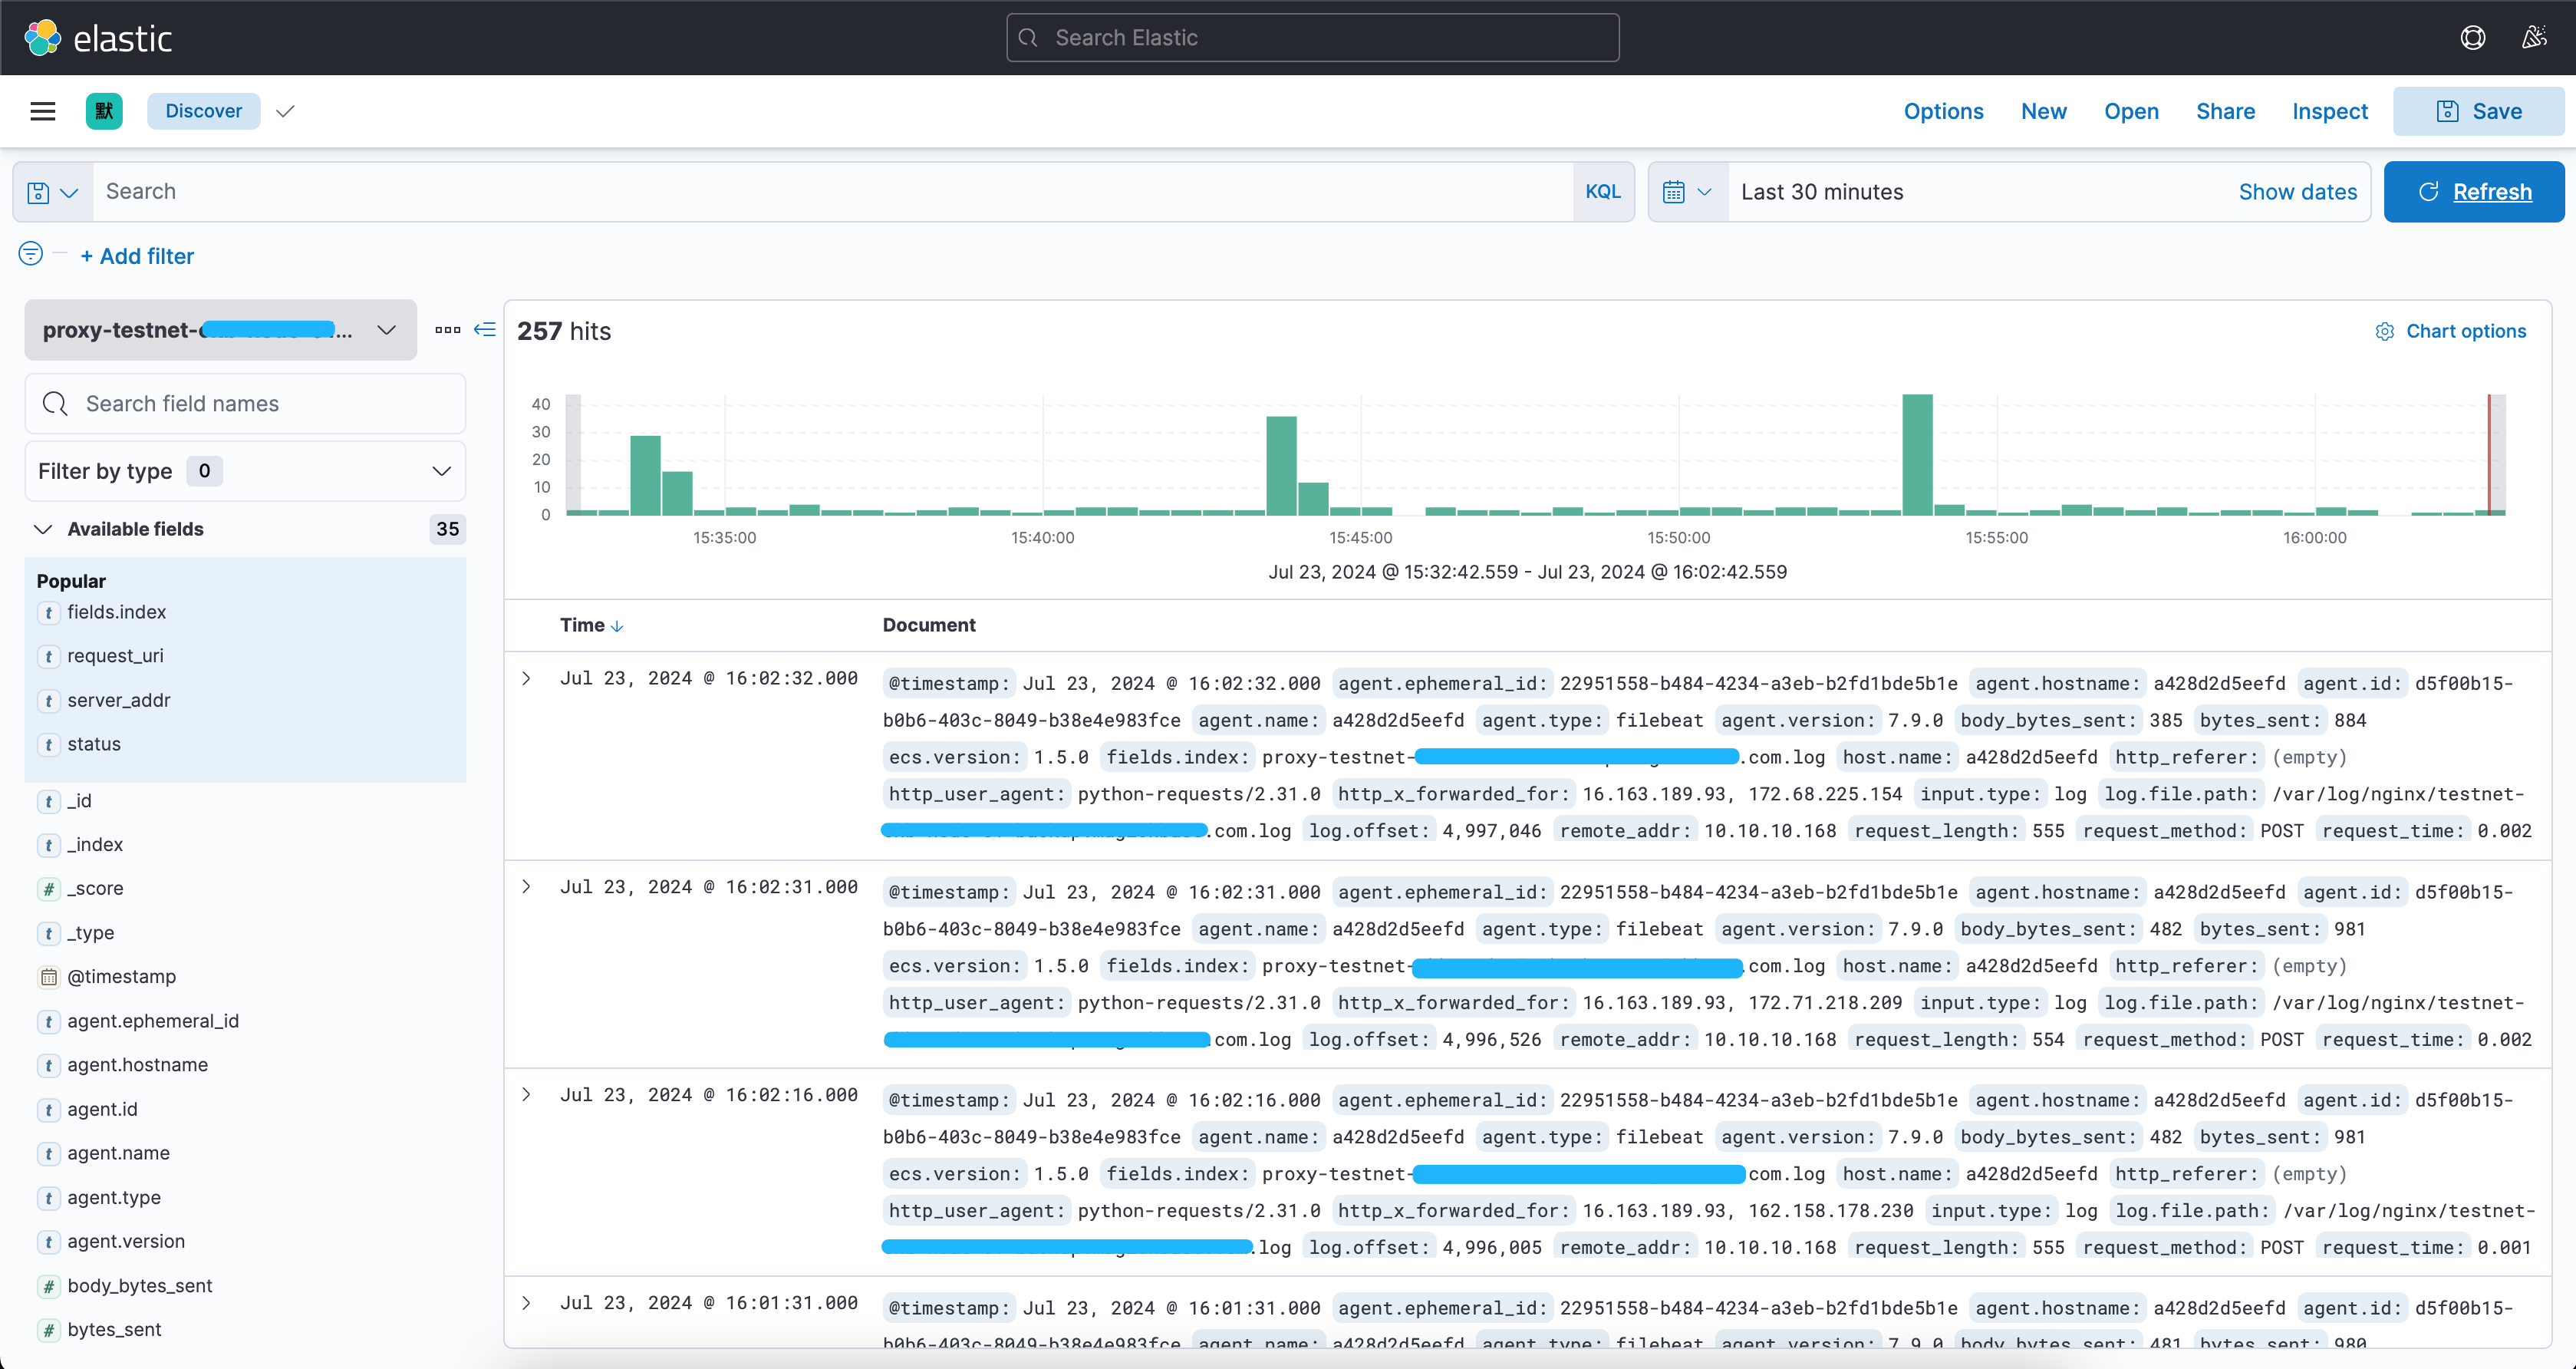
最后直接就可以看到收集到的日志kibana已经做好了字段分隔,只需要选择需要的字段,或者匹配某些字段就可以了。
比如 我想看状态码大于等于500的: status >= 500,都可以在上面的搜索框中去定义筛选
当然也可以把这个日志做成可视化,但选择某个指标的时候,其他指标也可以联动起来,例如: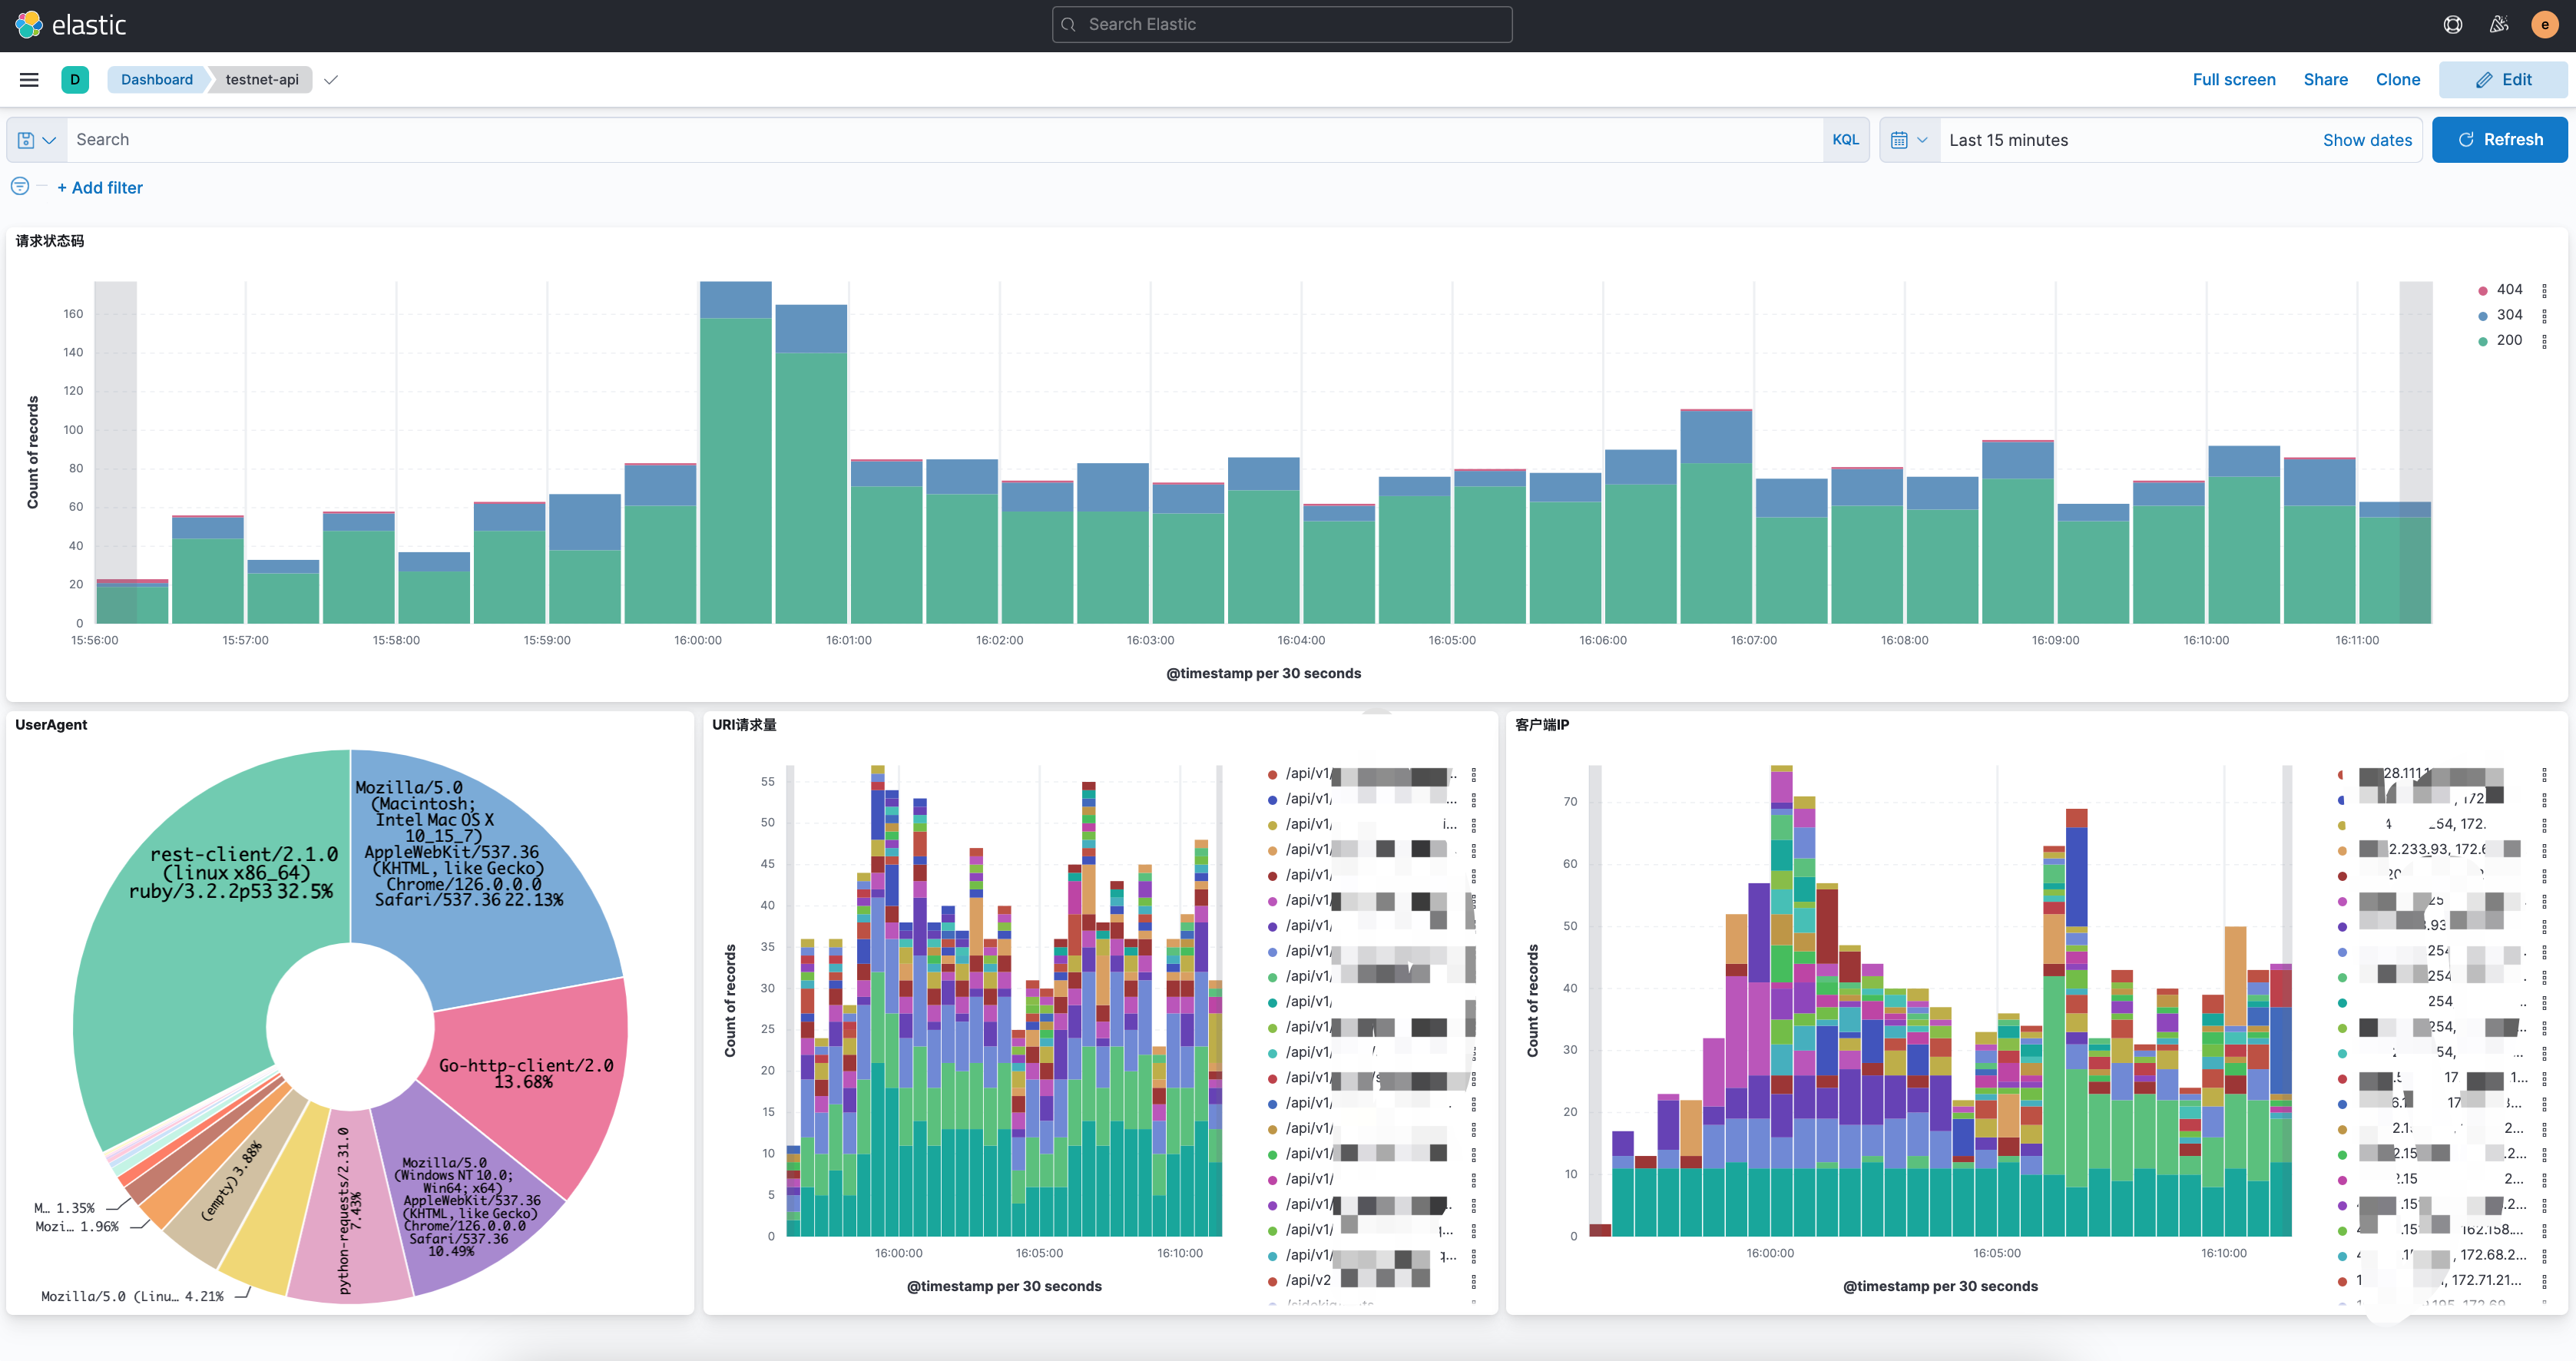
最后再结合前面写过的 如何利用ElastAlert2对ES中的日志创建告警 就可以轻松的对日志进行监控告警啦~
写在最后
上面过程仅仅是记录,主要还是思路。

k8s version
1 |
|
 wechat
 alipay


