背景 线上API服务出现了5xx的请求错误, 未能在第一时间发现导致用户主动向团队报告接口有异常, 由于API的接口比较多,也只是监控了部分,事后通过日志才发现的确用户侧在对某个接口访问时,频繁出现5xx告警,我这边也没有收到什么通知,目前先暂且不说出现5xx是什么造成的,而是在API接口响应状态的监控方面没有做到很到位, 所以需要对Nginx日志中的状态为5xx的请求监控告警,以便能快速响应,解决问题。
ElastAlert2 ElastAlert 2是一个简单的框架,用于对来自 Elasticsearch 和 OpenSearch 的数据的异常、尖峰或其他感兴趣的模式发出警报。
官方文档:https://elastalert2.readthedocs.io/en/latest/
Github: https://github.com/jertel/elastalert2
配置部署 当然还是选择容器化方式运行,官方也提供得有镜像:
1 docker pull docker pull jertel/elastalert2
配置文件配置 可参考 https://github.com/jertel/elastalert2 目录中的 examples/config.yaml.example
1
2
3
4
5
6
7
8
9
10
11
12
13
14
15
16
17
18
19
20
mkdir -p /opt/elastalert2/{data,rules} vim /opt/elastalert2/config.yaml rules_folder: rules run_every: minutes: 1 buffer_time: minutes: 15 es_host: 10.10 .20 .23 es_port: 9200 use_ssl: True verify_certs: True ca_certs: /opt/elastalert/ca.crt ssl_show_warn: True es_send_get_body_as: GET es_username: es_password: writeback_index: elastalert_status alert_time_limit: days: 2
Rule规则配置 我们网关服务器的Nginx日志是通过filebeat写到Elasticsearch的,也做好了index,其实在ELK 界面也可以看到这些状态数据,但是仅仅只是展示,没有告警,所以才有了这篇blog。
创建一个针对 某个API域名的日志的状态监控文件:
1
2
3
4
5
6
7
8
9
10
11
12
13
14
15
16
17
18
19
20
21
22
23
24
25
26
27
28
29
30
31
32
33
34
35
36
37
38
39
40
41
42
43
44
45
46
47
48
49
50
51
52
53
54
55
56
57
58
59
60
vim /opt/elastalert2/rules/mainnet-api.xxxxx.yaml #rule名字,必须唯一 name : The number of times this request responds with a status code of 5xx in the log is greater than 5 times within 1 minute, please pay attention(mainnet-api.xxxxx)! type : frequency index : proxy-mainnet-api.xxxxx.log-* num_events : 1 timeframe : seconds : 5 filter : - range: status : from : 500 to : 599 alert_text_type : alert_text_only alert_text : " 响应状态码 : {} \n 发生时间UTC : {} \n ES Index : {} \n num_hits : {} \n 请求URL : https://mainnet-api.xxxxx{} \n ClientIP : {} \n num_matches : {} \n http_user_agent : {} " alert_text_args : - status - "@timestamp" - _index - num_hits - request_uri - http_x_forwarded_for - num_matches - http_user_agent alert : - "discord" discord_webhook_url : "YOUR DISCORD WEBHOOK URL" discord_emoji_title : ":lock:" discord_embed_color : 0xE24D42 discord_embed_footer : "Message sent by from api status moniotor(for @noardguo)" discord_embed_icon_url : "https://humancoders-formations.s3.amazonaws.com/uploads/course/logo/38/thumb_bigger_formation-elasticsearch.png"
部署运行 上面已经准备好了所需要的文件:
1 2 3 4 5 6 7 8 9 root@ip -10 -10 -10 -11 :/opt/elastalert2 . ├── ca.crt ├── config.yaml ├── data └── rules ├── mainnet-api.xxxxx.yml 2 directories, 3 files
docker 方式运行:
1
2
3
4
5
6
7
8
9
10
11
12
13
14
15
16
17
18
19
20
docker run -d --name=elastalert2 \ --env=TZ=Asia/Shanghai \ --volume=/opt /elastalert2/data:/opt /elastalert/data \ --volume=/opt /elastalert2/config.yaml:/opt /elastalert/config.yaml \ --volume=/opt /elastalert2/rules:/opt /elastalert/rules \ --volume=/opt /elastalert2/ca .crt:/opt /elastalert/ca .crt \ --restart=always \ jertel/elastalert2 root@ip-10 -10 -10 -11 :/opt /elastalert2# docker logs -f wonderful_tharp Reading Elastic 7 index mappings: Reading index mapping 'es_mappings/7/silence.json' Reading index mapping 'es_mappings/7/elastalert_status.json' Reading index mapping 'es_mappings/7/elastalert.json' Reading index mapping 'es_mappings/7/past_elastalert.json' Reading index mapping 'es_mappings/7/elastalert_error.json' Index elastalert_status already exists . Skipping index creation. WARNING:py .warnings:/usr/local/lib/python3 .12 /site-packages/elasticsearch/connection/base.py :193 : ElasticsearchDeprecationWarning: Camel case format name dateOptionalTime is deprecated and will be removed in a future version . Use snake case name date_optional_time instead. warnings.warn(message, category=ElasticsearchDeprecationWarning)
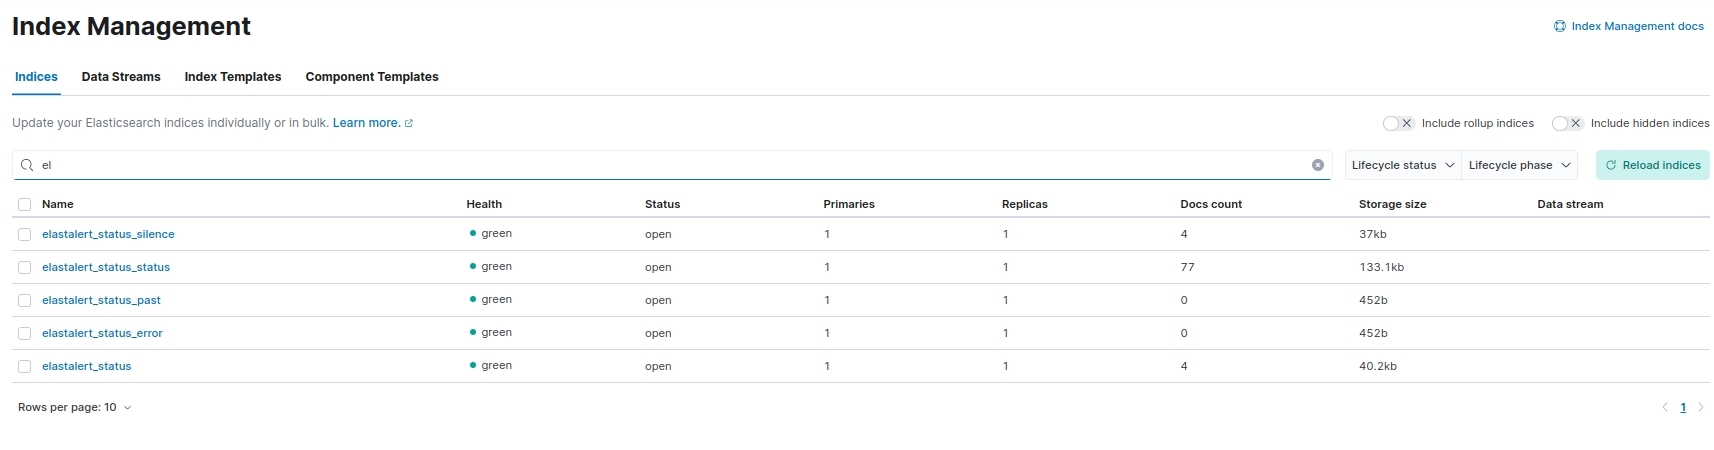
如果没有报错就说明运行正常,此时从kibana面板也可以看到ElaltAlert2生成了监控告警所需要的index:
测试 当运行起来后,此时就是是时间监控日志文件的一个状态
在网关服务器上面echo一段带有status为500的message到日志文件中:
1 echo '''{"@timestamp" :"2024-07-16T20:28:10+08:00" ,"server_addr" :"110.10.30.187" ,"remote_addr" :"10.10.10.248" ,"http_x_forwarded_for" :"172.104.86.126, 172.68.119.188" ,"scheme" :"http" ,"request_method" :"POST" ,"request_uri" : "Alert_Test" ,"request_length" : "953" ,"uri" : "/api/v1/alerttest" , "request_time" :0 .002 ,"body_bytes_sent" :0 ,"bytes_sent" :335 ,"status" :"500" ,"upstream_time" :"0.002" ,"upstream_host" :"10.10.10.139:31333" ,"upstream_status" :"200" ,"host" :"mainnet-api.xxxxxx" ,"http_referer" :"https://test.xyz/" ,"http_user_agent" :"Mozilla/5.0 (Macintosh; Intel Mac OS X 10_15_7) AppleWebKit/537.36 (KHTML, like Gecko) Chrome/126.0.0.0 Safari/537.36" }''' >> mainnet-api.xxxxxx.log
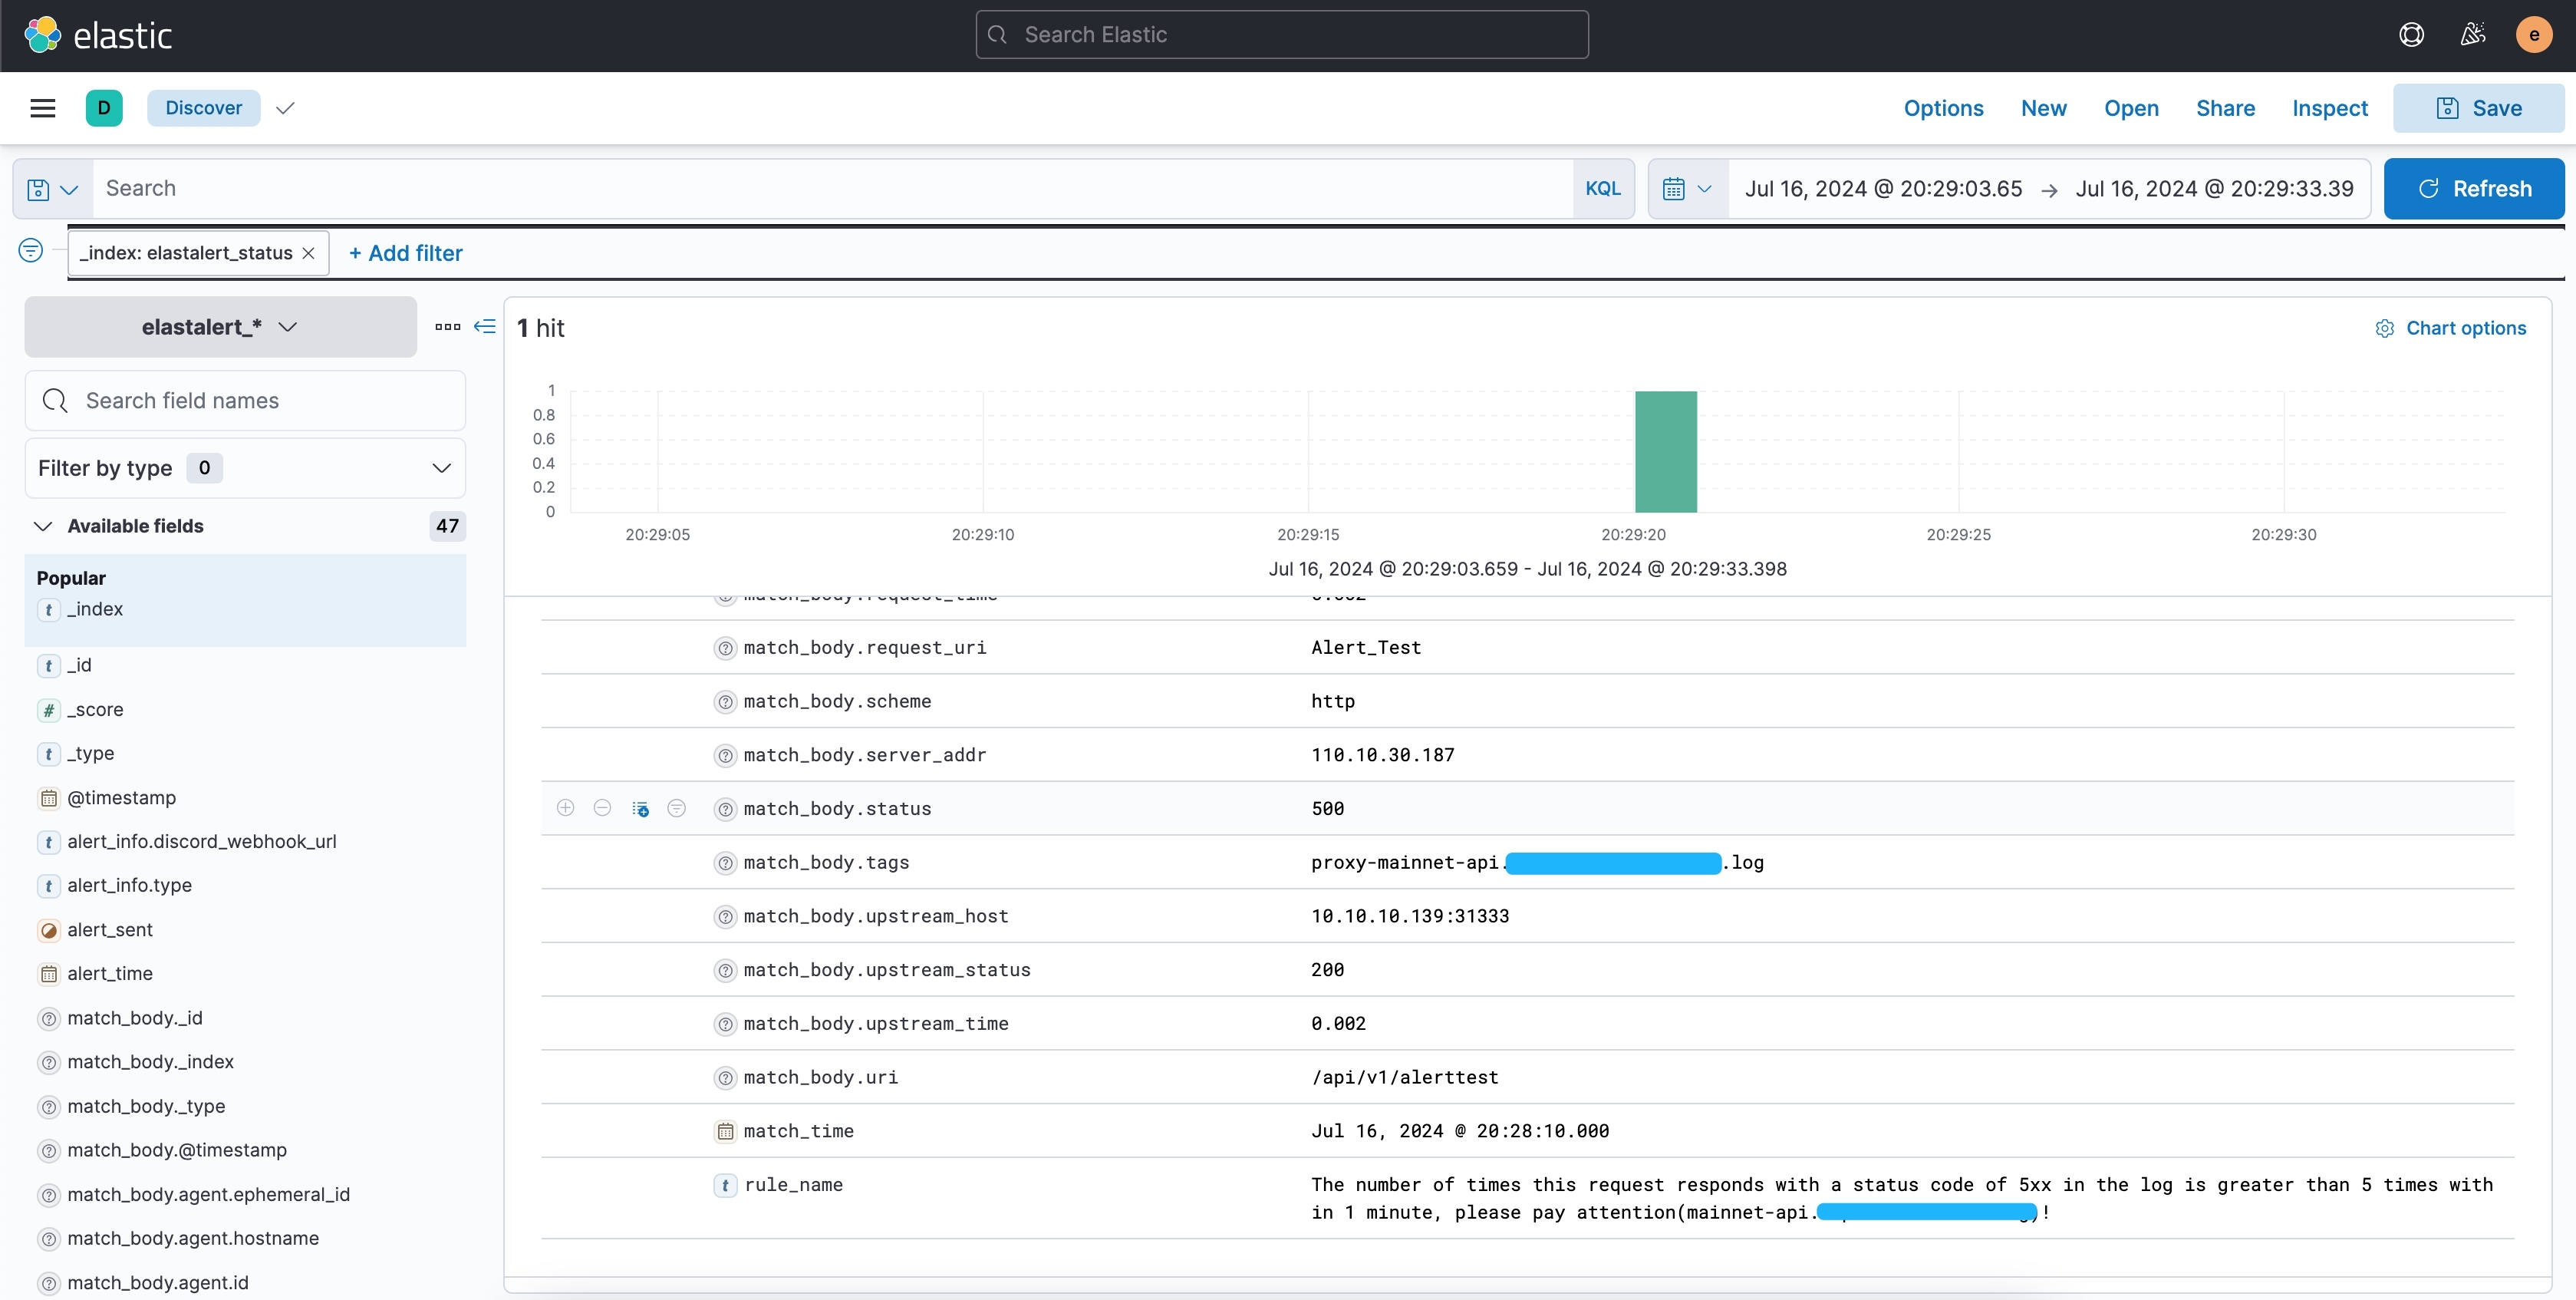
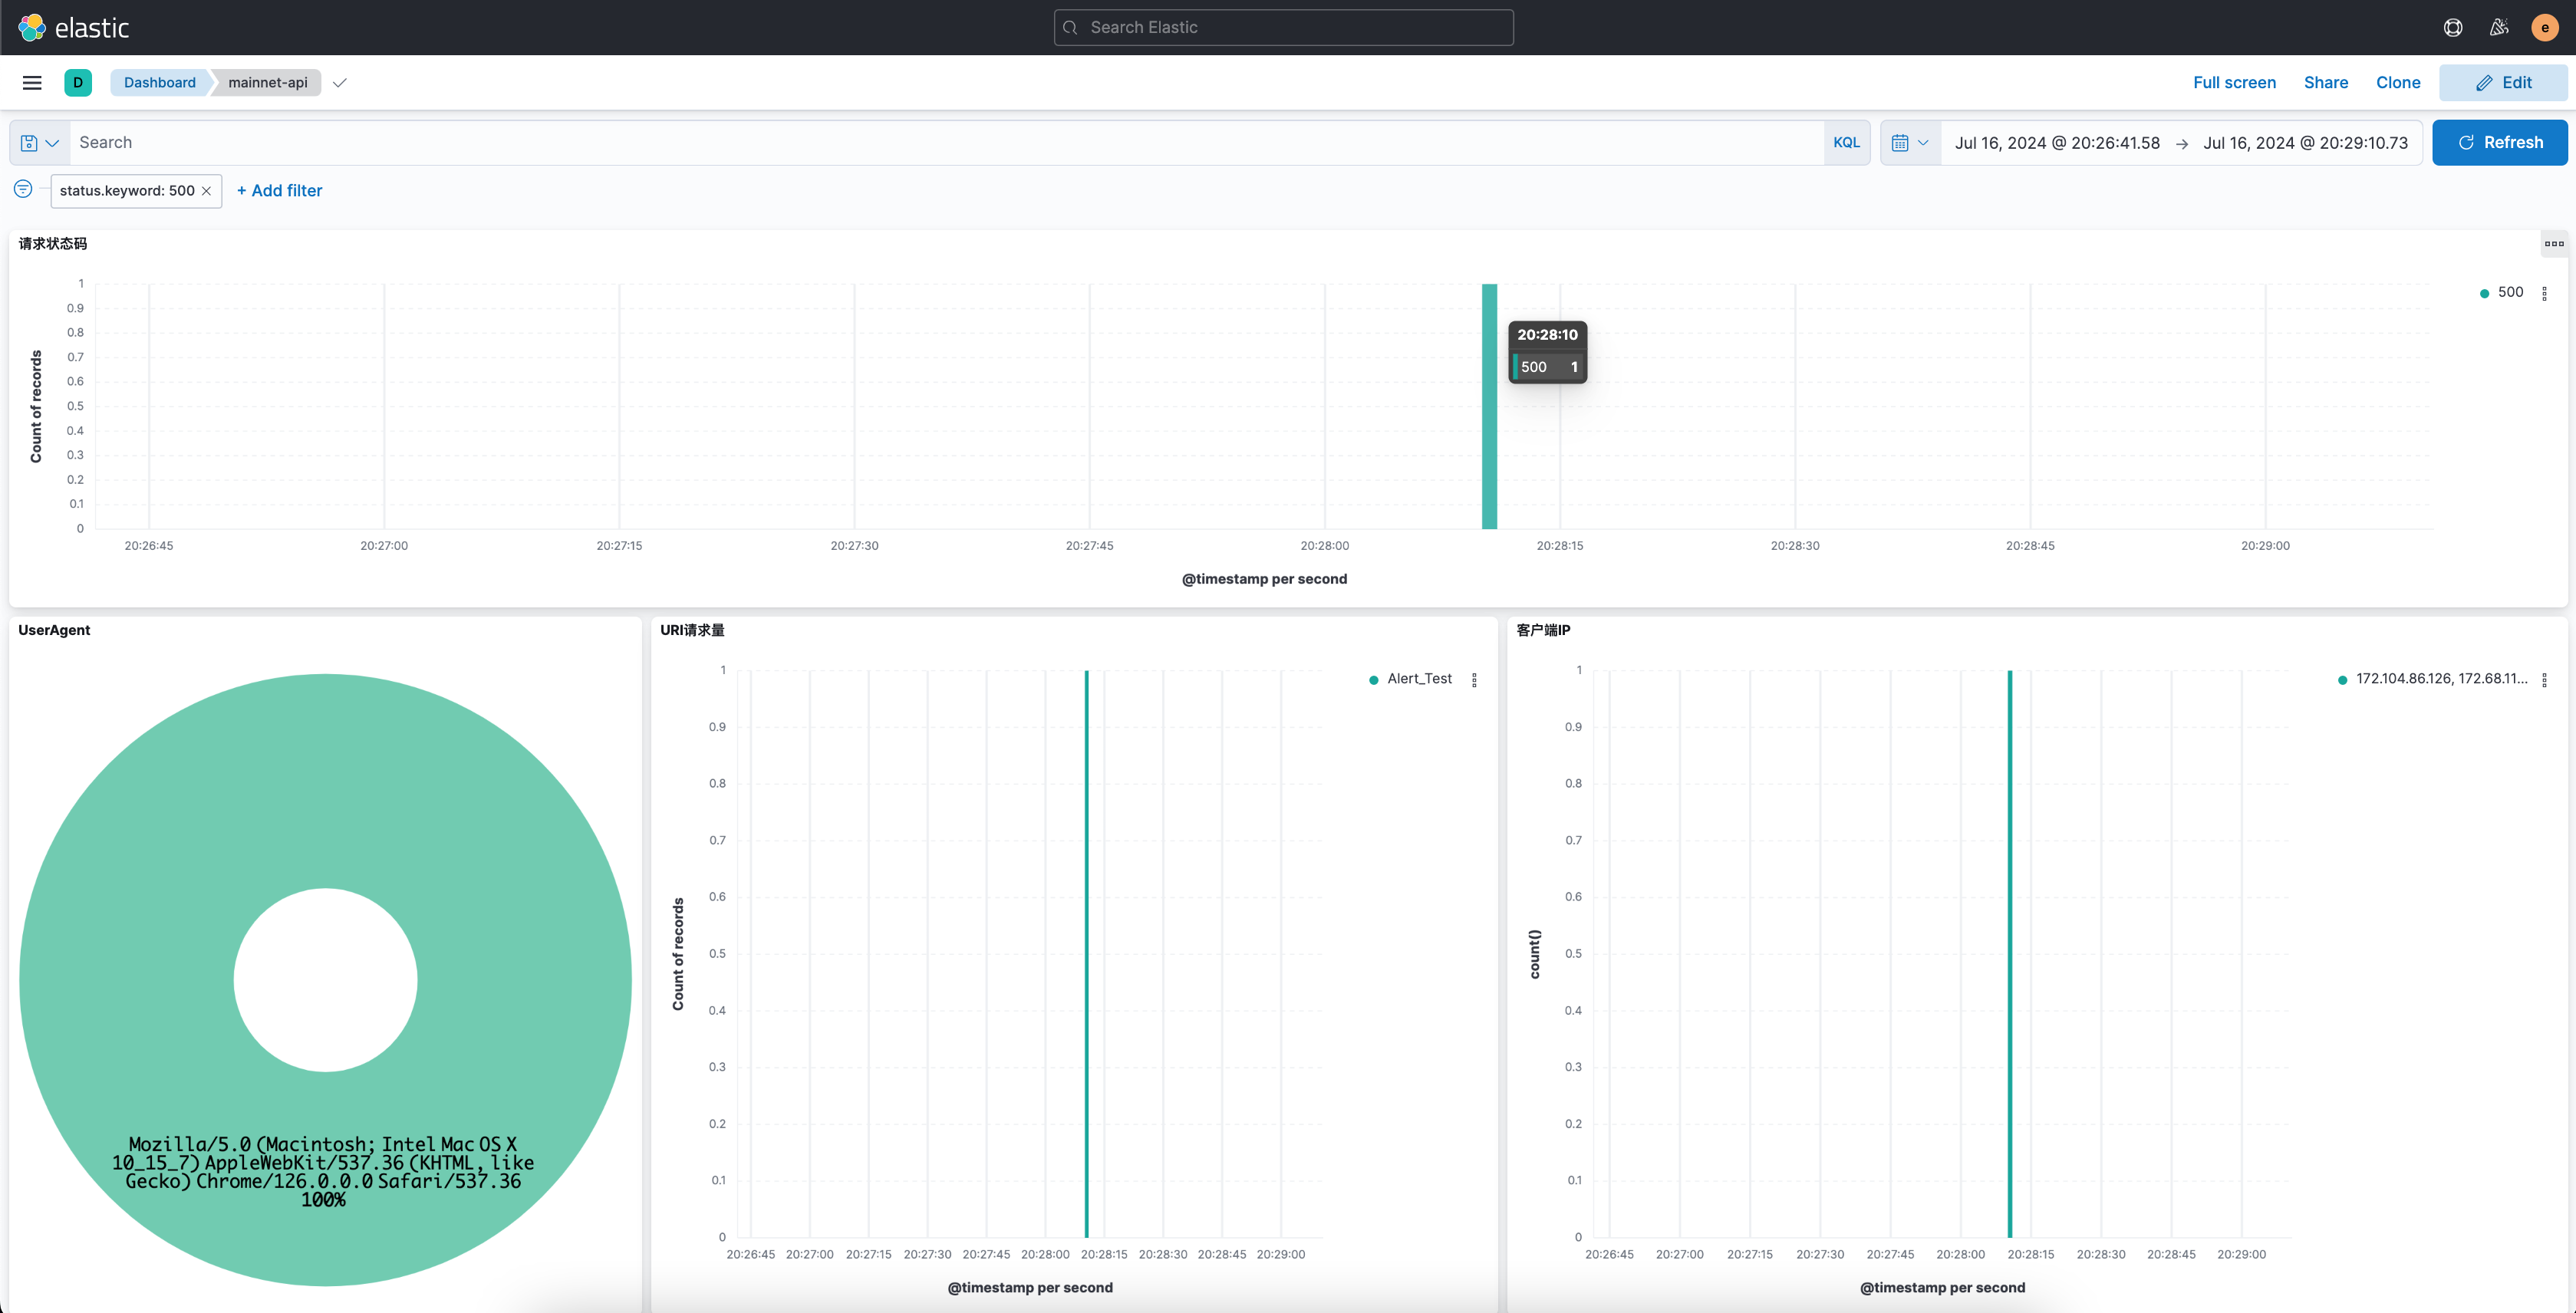
此时查看 index已经记录到这条告警消息, 通过查询索引也找到了这个请求
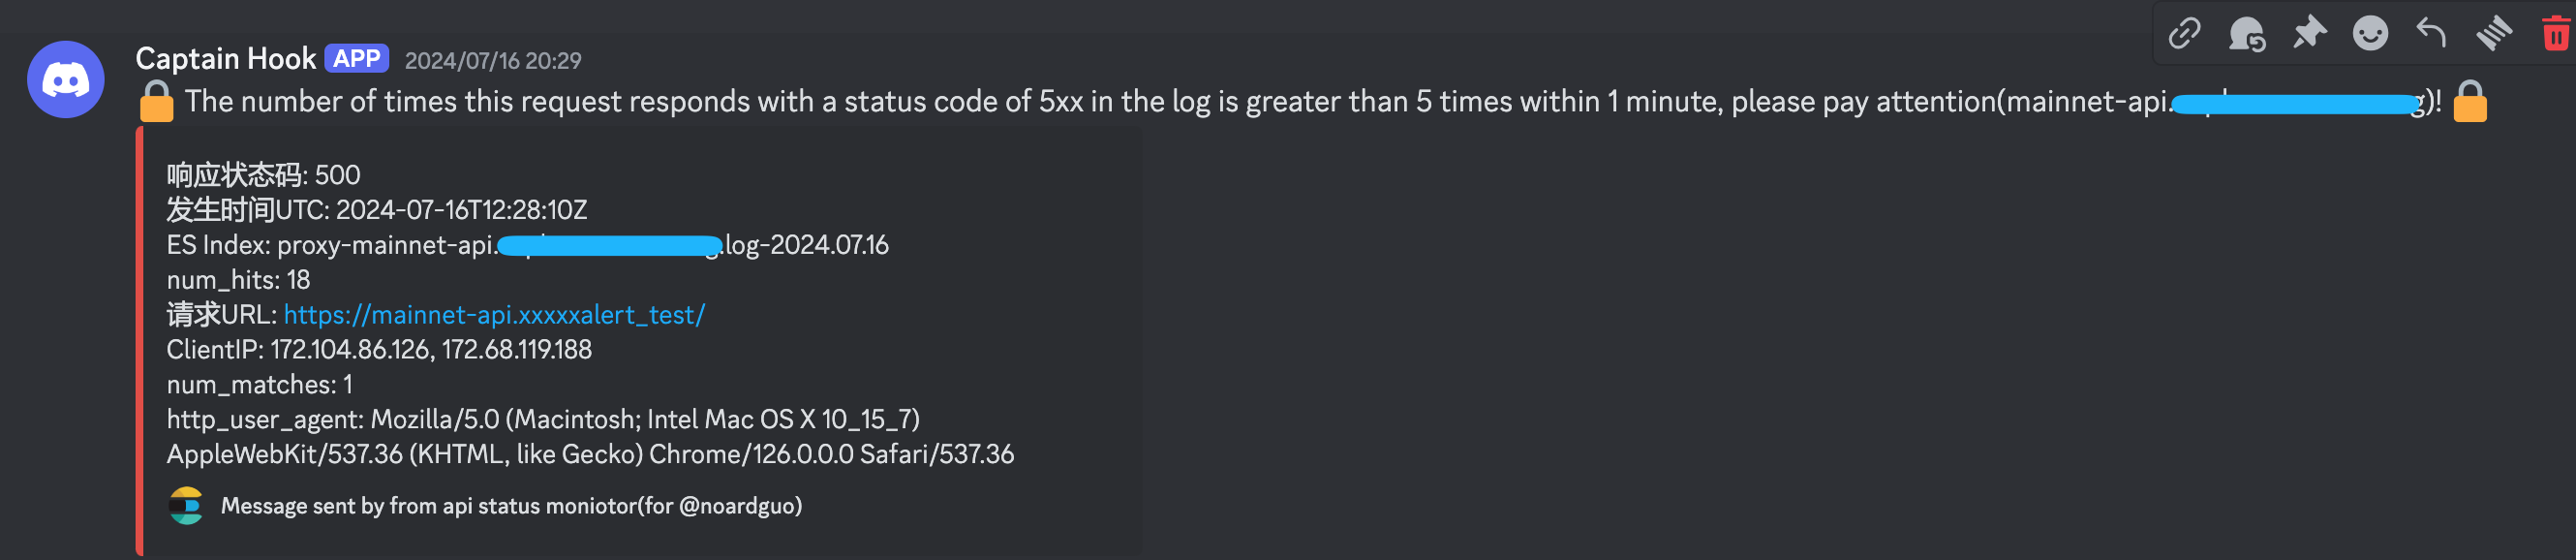
同时,Discord也收到了告警通知
最后,因为我们跑了k8s,下面直接把相关文件用configmap方式挂载进去,运行一个Deployment副本即可。
1
2
3
4
5
6
7
8
9
10
11
12
13
14
15
16
17
18
19
20
21
22
23
24
apiVersion: v1data: config.yaml: |- rules_folder: rules run_every: minutes: 1 buffer_time: minutes: 15 es_host: 10.10 .20.23 es_port: 9200 use_ssl: True verify_certs: True ca_certs: /opt/elastalert/ca.crt ssl_show_warn: True es_send_get_body_as: GET es_username: elastic es_password: A2VdKUHHFoUmlyekVFgd writeback_index: elastalert_status alert_time_limit: days: 2 metadata: name: elastalert-config namespace: monitor
1
2
3
4
5
6
7
8
9
10
11
12
13
14
15
16
17
18
19
20
21
apiVersion: v1data: mainnet-api.xxxxxx.yml: "#rule名字,必须唯一\n name: The number of times this request responds with a status code of 5xx in the log is greater than 5 times within 1 minute, please pay attention(mainnet-api.xxxxx)!\n \n #类型,官方提供多种类型\n type: frequency\n \n #ES索引,支持通配符\n index: proxy-mainnet-api.xxxxx.log-*\n \n #在timeframe时间内,匹配到多少个结果便告警\n num_events: 1\n \n #监控周期.默认是minutes: 1\n timeframe:\n seconds: 5 \n \n #匹配模式.\n filter:\n - range:\n \ status:\n from: 500\n to: 599\n \n alert_text_type: alert_text_only\n alert_text: \" \n 响应状态码: {} \\ n\n 发生时间UTC: {} \\ n\n ES Index: {} \\ n\n num_hits: {} \\ n\n \ 请求URL: https://mainnet-api.xxxxx.org{} \\ n\n ClientIP: {} \\ n\n num_matches: {} \\ n\n http_user_agent: {}\n \" \n alert_text_args:\n - status\n - \" @timestamp\" \n \ - _index\n - num_hits\n - request_uri\n - http_x_forwarded_for\n \ - num_matches\n - http_user_agent\n \n \n alert:\n - \" discord\" \n #discord_webhook_url: \" DISCORD_WEBHOOK_URL" \ndiscord_webhook_url: \"https://https://discord.com/api/webhooks/1196752947493752933/VRQ01W1pT0PHpl55z0hayqsyjWzt3bzXUMSA4-_5W56fn9j5Nl1zDQT7ZtU_CQWnnlYH\" \n discord_emoji_title: \" :lock:\" \n discord_embed_color: 0xE24D42\n discord_embed_footer: \" Message sent by from api status moniotor(for @Ops-NoardGuo)\" \n discord_embed_icon_url: \" https://humancoders-formations.s3.amazonaws.com/uploads/course/logo/38/thumb_bigger_formation-elasticsearch.png\" kind: ConfigMap metadata: name: ealstalert-rules namespace: monitor
1
2
3
4
5
6
7
8
9
10
11
12
13
14
15
16
17
18
19
20
21
22
23
24
25
26
27
28
29
30
31
32
33
34
35
36
37
38
39
40
41
42
43
44
45
46
47
48
49
50
51
52
53
54
55
56
57
58
59
60
61
62
63
64
65
66
--- apiVersion: apps/v1 kind: Deployment metadata: annotations: k8s.kuboard.cn/displayName: elastalert labels: k8s.kuboard.cn/name: elastalert name: elastalert namespace: monitor spec: progressDeadlineSeconds: 600 replicas: 1 revisionHistoryLimit: 10 selector: matchLabels: k8s.kuboard.cn/name: elastalert strategy: rollingUpdate: maxSurge: 25 % maxUnavailable: 25 % type: RollingUpdate template: metadata: labels: k8s.kuboard.cn/name: elastalert spec: containers: - args: - '--verbose' - image: jertel/elastalert2 imagePullPolicy: IfNotPresent name: elastalert resources: {} terminationMessagePath: /dev/termination-log terminationMessagePolicy: File volumeMounts: - mountPath: /opt/elastalert/config.yaml name: volume-ps74r subPath: config.yaml - mountPath: /opt/elastalert/rules/ name: rules - mountPath: /opt/elastalert/ca.crt name: volume-zmdx7 subPath: ca.crt dnsPolicy: ClusterFirst restartPolicy: Always schedulerName: default-scheduler securityContext: {} terminationGracePeriodSeconds: 30 volumes: - configMap: defaultMode: 420 name: elastalert-config name: volume-ps74r - configMap: defaultMode: 420 items: - key: mainnet-api.xxxxx.yml path: mainnet-api.xxxxx.yml name: ealstalert-rules name: rules - configMap: defaultMode: 420 name: elasticsearch-ca.crt name: volume-zmdx7
至此告警功能已经实现,以上只是一个大体的思路,不仅仅监控的可以是状态码,应该是你能想到的,他能提供的都可以监控起来。
好啦,我要去看5xx的报错原因了😀
 wechat
 alipay


