一、背景 因公司历史遗留原因有个别环境暂时没有使用kubernets, 现在需要将这批服务器的监控系统从zabbix替换到Prometheus, 于是乎这边有个问题就是需要将所有服务器上面的所有的exporter mertics(即 target)地址写到Prometheus配置文件中,这样一来,维护一个文件,似乎还算可以,但是这里我采用Prometheus+Consul的方式来管理服务器上的所有exporter, 那么这样做的好处是我们能更清晰的通过Consul来管理上面的每个exporter url , 以及通过consul自带的自定义元数据,再结合Promethues无疑是个很灵活的方式。
二、架构
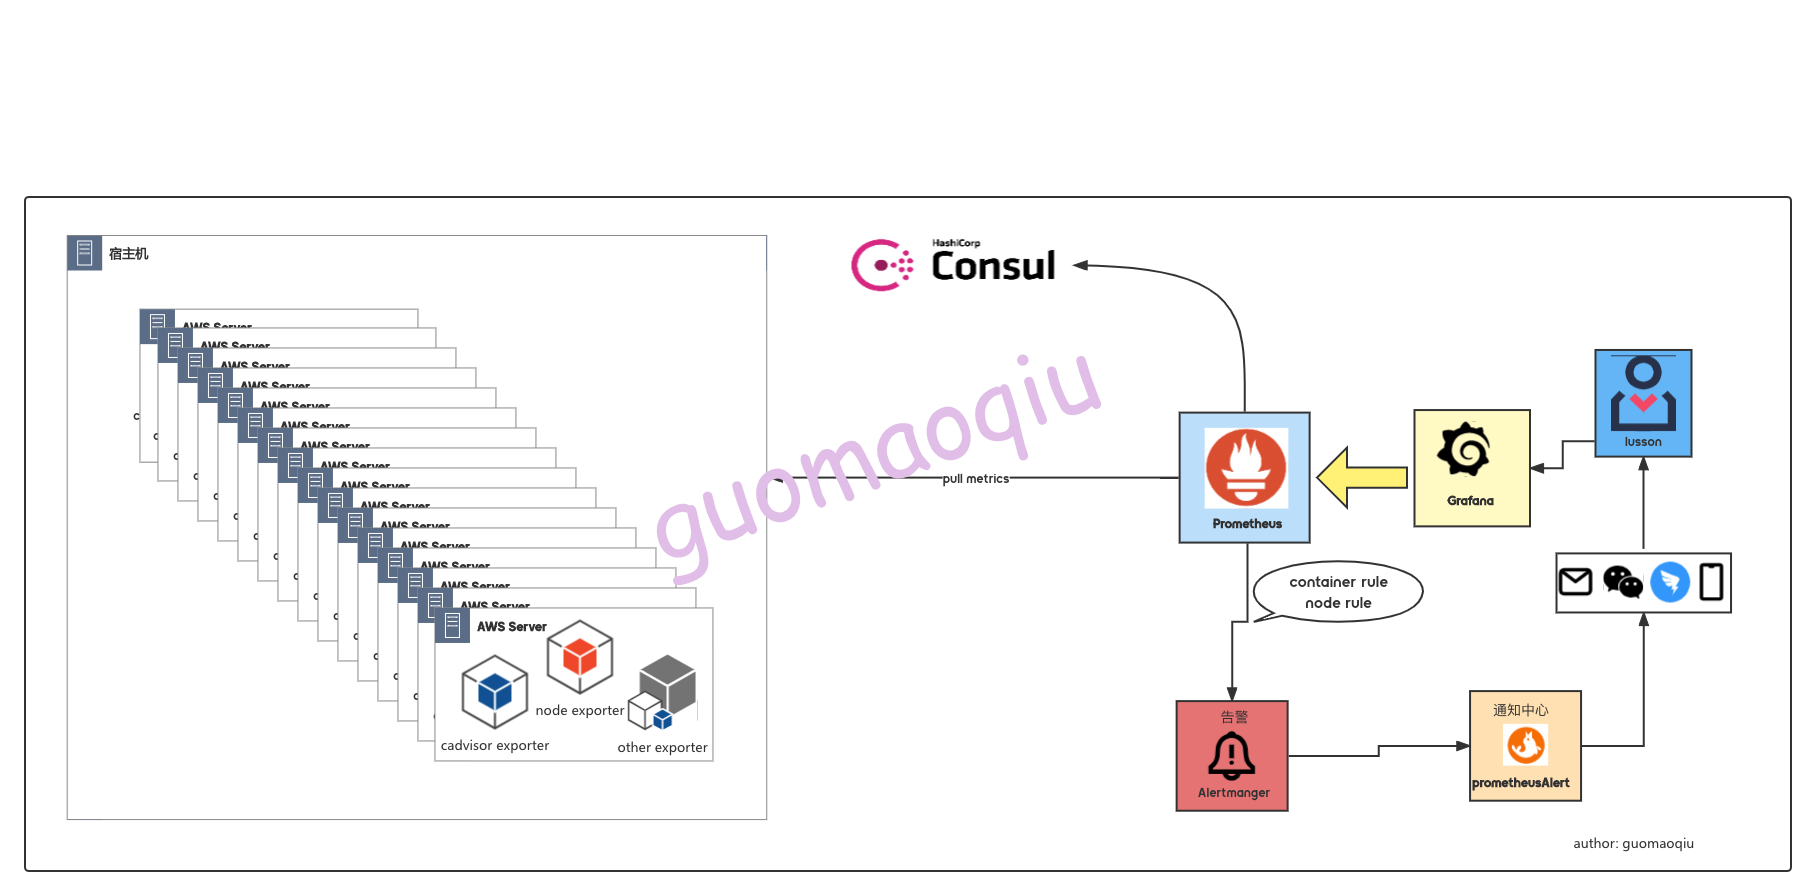
promtheus配置数据源为consu_sd_configs 地址指向一个consul客户端地址;
通过脚本调用consulapi的方式将宿主机上面的cadvisor-exporter,node-exporter metrics的地址注册到consul中;
promtheus 检测到了新增服务后,会通过这个http://xxxxxx:xxx/metrics url 抓取采集数据;
后续的数据采集就跟平常我们使用的方式一样了,采集到的数据时序保存在promtheus;
Grafana作为采集数据的一个展示,通过各种label,更加方便的对面板进行配置;
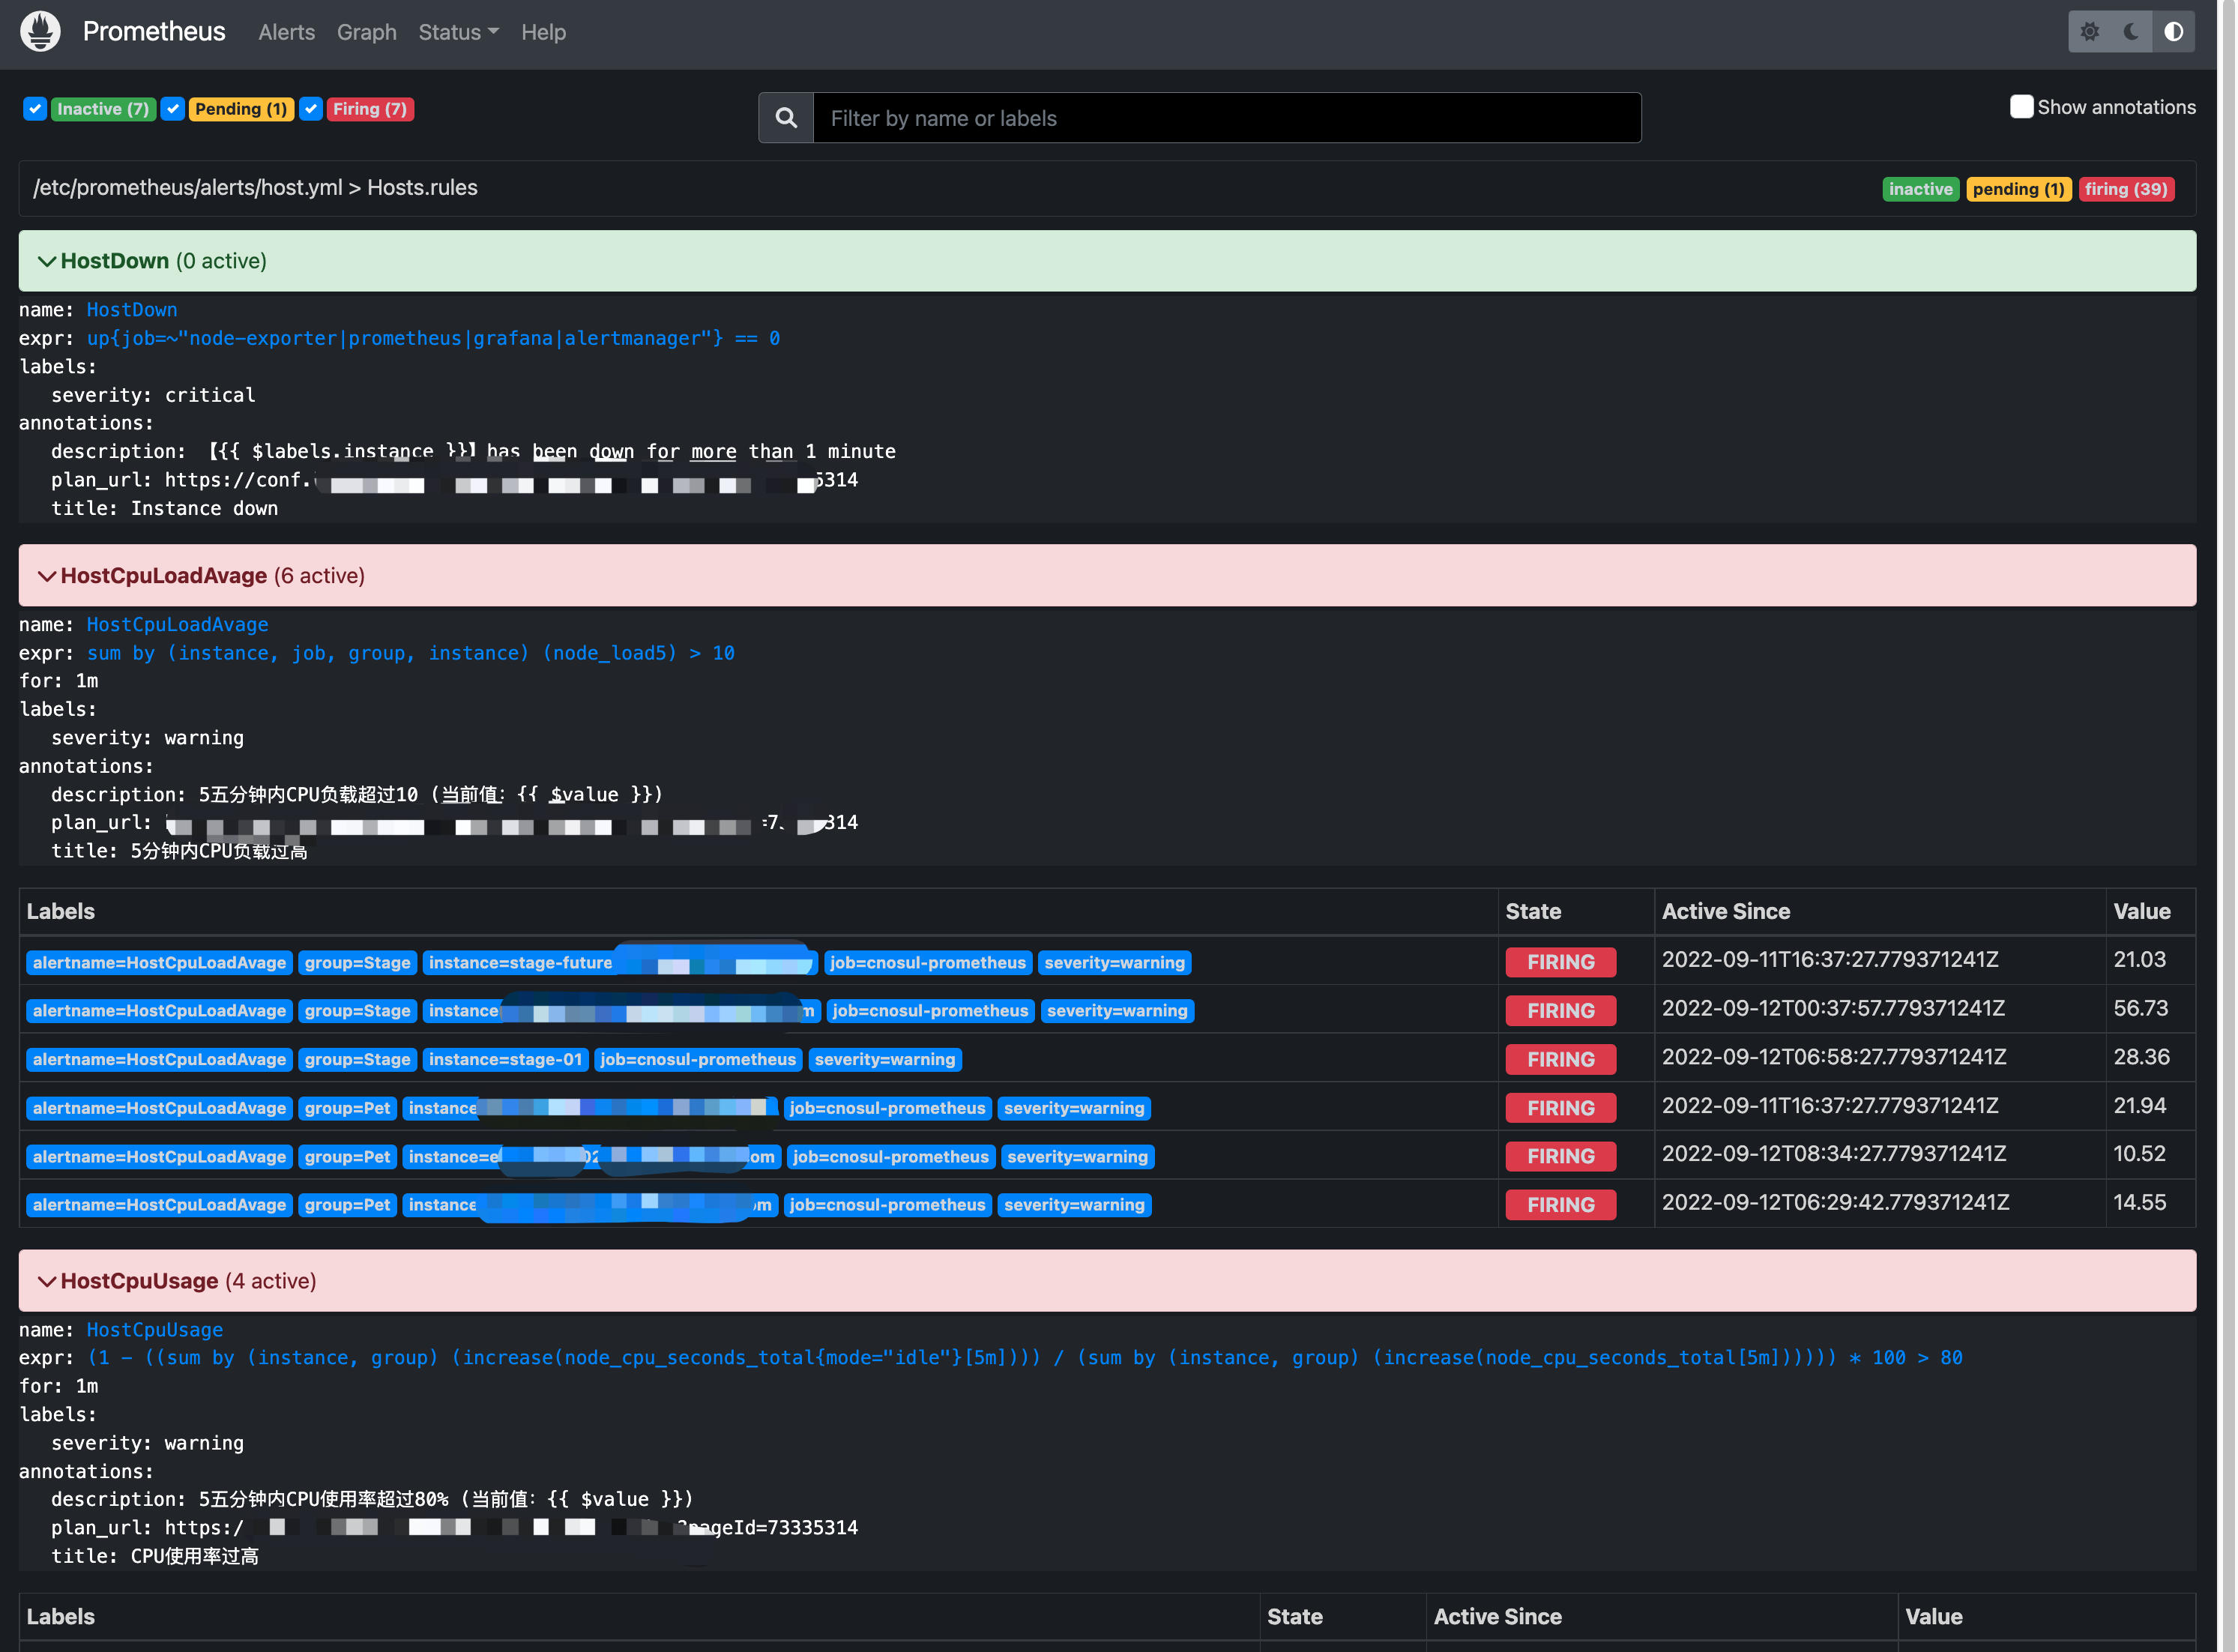
添加node-exporter, cadvisor-exporter的指标报警规则,通过Alertmanager 发出主机或容器的告警;
三、实现 Prometheus以及周边组件部署 该编排文件中部署了
Prometheus: 监控系统主程序
Alertmanager: 告警发送
Grafana: 数据展示
Prometheus-dingding-webhook: 钉钉告警推送
alertmanager-dashboard: 主要用于告警条目展示,该软件是开源项目,随意下载部署
1
2
3
4
5
6
7
8
9
10
11
12
13
14
15
16
17
18
19
20
21
22
23
24
25
26
27
28
29
30
31
32
33
34
35
36
37
38
39
40
41
42
43
44
45
46
47
48
49
50
51
52
53
54
55
56
57
58
59
60
61
62
63
64
65
66
67
68
69
70
71
72
73
74
75
76
77
78
79
80
81
82
83
84
85
86
87
88
89
90
91
92
93
94
95
96
97
98
99
100
101
102
103
104
cat > docker-compose.yaml << EOF version : '3.7' services : prometheus : image : prom/prometheus:latest volumes : - ./prometheus/:/etc/prometheus/ - /data/prometheus-data:/prometheus command : - '--config.file=/etc/prometheus/prometheus.yml' - '--storage.tsdb.path=/prometheus' - '--web.console.libraries=/usr/share/prometheus/console_libraries' - '--web.console.templates=/usr/share/prometheus/consoles' - '--web.enable-lifecycle' - '--web.external-url=http://192.168.18.178:9090' ports : - 9090:9090 links : - alertmanager:alertmanager restart : always deploy : resources : limits : cpus : "1.0" memory : 500M alertmanager : image : prom/alertmanager ports : - 9093:9093 volumes : - ./alertmanager/:/etc/alertmanager/ restart : always command : - '--config.file=/etc/alertmanager/config.yml' - '--storage.path=/alertmanager' deploy : resources : limits : cpus : "1.0" memory : 500M grafana : image : grafana/grafana:8.4.0 depends_on : - prometheus ports : - 3000:3000 volumes : - /data/grafana-data:/var/lib/grafana - ./grafana/provisioning/:/etc/grafana/provisioning/ env_file : - ./grafana/config.monitoring restart : always deploy : resources : limits : cpus : "1.0" memory : 500M webhook : image : timonwong/prometheus-webhook-dingtalk depends_on : - prometheus volumes : - ./prometheus-webhook-dingtalk/config.yml:/config/config.yml - ./prometheus-webhook-dingtalk/dingding.tmpl:/config/dingding.tmpl ports : - 9060:8060 command : - '--web.listen-address=:8060' - '--config.file=/config/config.yml' - '--web.enable-ui' - '--web.enable-lifecycle' restart : always deploy : resources : limits : cpus : "1.0" memory : 500M alertmanager-dashboard : image : ghcr.io/prymitive/karma:latest ports : - 9094:8080 restart : always environment : - ALERTMANAGER_URI=http://192.168.18.178:9093 deploy : resources : limits : cpus : "1.0" memory : 500M EOF docker-compose up -d
以上运行起来后,基本的功能已经完成,此时只需要将target添加到prometheus中就可以了
3.2 exporter(数据采集器)部署 上面提到我们这部分环境没有迁移到k8s,所有微服务都是docker方式运行在宿主机上面的,所以,这里需要单独需要去部署对宿主机跟容器的eporter(数据采集器), 目前的需求就是监控宿主机以及容器,并将采集到的数据进行展示、告警等。
宿主机的监控:利用Prometheus搭建部署监控系统,那么对于服务器层面的数据采集我们首选的是node-exporter;
容器的监控:在调研容器监控这块儿的时候发现container-exporter监控指标虽然能满足我们的需求,但是发现采集的数据过于简洁且在运行过程中会造成内存积压最终导致服务不可用,除非是人为干涉重启一下,释放内存,但是这种事儿不应该发生。因此还是采用cadvisor exporter来进行容器的数据采集
需要在每台宿主机上面部署两个exporter
创建目录(一般放到普通用户app家目录即可) 1 mkdir exporter-deploy && cd exporter-deploy
编排文件准备 1 2 3 4 5 6 7 8 9 10 11 12 13 14 15 16 17 18 19 20 21 22 23 24 25 26 27 28 29 30 31 32 33 34 35 36 37 38 39 40 41 42 43 44 45 46 47 48 49 50 51 52 53 54 55 cat > docker-compose.yaml << EOF version : '3.7' services : node-exporter : image : bitnami/node-exporter:latest volumes : - /proc:/host/proc:ro - /sys:/host/sys:ro - /:/rootfs:ro - /:/host:ro,rslave command : - '--path.rootfs=/host' - '--path.procfs=/host/proc' - '--path.sysfs=/host/sys' - --web.disable-exporter-metrics - --collector.filesystem.ignored-mount-points - "^/(sys|proc|dev|host|etc|rootfs/var/lib/docker/containers|rootfs/var/lib/docker/overlay2|rootfs/run/docker/netns|rootfs/var/lib/docker/aufs)($$|/)" ports : - 9100:9100 restart : always deploy : resources : limits : cpus : "1.0" memory : 500M cadvisor-exporter : image : gcr.io/cadvisor/cadvisor/cadvisor:v0.45.0 volumes : - /:/rootfs:ro - /var/run:/var/run:rw - /sys:/sys:ro - /var/lib/docker/:/var/lib/docker:ro command : - "-docker_only=true" - "-housekeeping_interval=10s" - "-docker_only=true" - "--allow_dynamic_housekeeping=false" - "--storage_duration=20s" ports : - 9105:8080 restart : always deploy : mode : global resources : limits : cpus : "2.0" memory : 500M EOF docker-compose up -d
以上,只需要此配置文件就部署好了 “exporter客户端”
下面就是 将这台服务器以及连个exporter的url 注册到consul中,如果有批量安装需求,直接在jump上面通过ansible 推送即可
3.3 consul 集群部署 手动创建一个docker 网络 1 docker network create --driver bridge --subnet 10.10.0.0 /24 consul-network
创建consul的数据、配置目录 1 2 sudo mkdir -p /data /consul/consul-server{1..3}/{data ,config }sudo mkdir -p /data /consul/consul-client{1..2}/{data ,config }
编辑docker-compose配置 1 2 3 4 5 6 7 8 9 10 11 12 13 14 15 16 17 18 19 20 21 22 23 24 25 26 27 28 29 30 31 32 33 34 35 36 37 38 39 40 41 42 43 44 45 46 47 48 49 50 51 52 53 54 55 56 57 58 59 60 61 62 63 64 65 66 67 68 69 70 71 72 73 74 75 76 77 78 79 80 81 82 83 84 85 86 87 88 89 cat > docker-compose-consul-cluster.yaml << \EOFversion: '3.7' services: consul-server1: image: consul:latest network_mode: consul-network container_name: consul-server1 restart: always command : agent -server -client=0.0.0.0 -bootstrap-expect=3 -node=consul-server1 -bind =0.0.0.0 -config-dir=/consul/config volumes: - /data/consul/consul-server1/data:/consul/data - /data/consul/consul-server1/config:/consul/config consul-server2: image: consul:latest network_mode: consul-network container_name: consul-server2 restart: always command : agent -server -client=0.0.0.0 -retry-join=consul-server1 -node=consul-server2 -bind =0.0.0.0 -config-dir=/consul/config volumes: - /data/consul/consul-server2/data:/consul/data - /data/consul/consul-server2/config:/consul/config depends_on: - consul-server1 consul-server3: image: consul:latest network_mode: consul-network container_name: consul-server3 restart: always command : agent -server -client=0.0.0.0 -retry-join=consul-server1 -node=consul-server3 -bind =0.0.0.0 -config-dir=/consul/config volumes: - /data/consul/consul-server3/data:/consul/data - /data/consul/consul-server3/config:/consul/config depends_on: - consul-server1 consul-client1: image: consul:latest network_mode: consul-network container_name: consul-client1 restart: always ports: - 8500:8500 command : agent -client=0.0.0.0 -retry-join=consul-server1 -ui -node=consul-client1 -bind =0.0.0.0 -config-dir=/consul/config volumes: - /data/consul/consul-client1/data:/consul/data - /data/consul/consul-client1/config:/consul/config depends_on: - consul-server2 - consul-server3 consul-client2: image: consul:latest network_mode: consul-network container_name: consul-client2 restart: always ports: - 8501:8500 command : agent -client=0.0.0.0 -retry-join=consul-server1 -ui -node=consul-client2 -bind =0.0.0.0 -config-dir=/consul/config volumes: - /data/consul/consul-client2/data:/consul/data - /data/consul/consul-client2/config:/consul/config depends_on: - consul-server2 - consul-server3 EOF docker-compose -f docker-compose-consul-cluster.yaml up -d docker ps -a CONTAINER ID IMAGE COMMAND CREATED STATUS PORTS NAMES 223826237a7b consul:latest "docker-entrypoint.s…" 3 seconds ago Up 2 seconds 8300-8302/tcp, 8301-8302/udp, 8600/tcp, 8600/udp, 0.0.0.0:8501->8500/tcp, :::8501->8500/tcp consul-client2 337a3188fb75 consul:latest "docker-entrypoint.s…" 3 seconds ago Up 2 seconds 8300-8302/tcp, 8301-8302/udp, 8600/tcp, 8600/udp, 0.0.0.0:8500->8500/tcp, :::8500->8500/tcp consul-client1 685440aefca3 consul:latest "docker-entrypoint.s…" 4 seconds ago Up 3 seconds 8300-8302/tcp, 8500/tcp, 8301-8302/udp, 8600/tcp, 8600/udp consul-server2 5f9927f2ecac consul:latest "docker-entrypoint.s…" 4 seconds ago Up 3 seconds 8300-8302/tcp, 8500/tcp, 8301-8302/udp, 8600/tcp, 8600/udp consul-server3 612b93b95ad9 consul:latest "docker-entrypoint.s…" 5 seconds ago Up 4 seconds 8300-8302/tcp, 8500/tcp, 8301-8302/udp, 8600/tcp, 8600/udp consul-server1 docker exec -it consul-server1 consul members Node Address Status Type Build Protocol DC Partition Segment consul-server1 10.10.0.2:8301 alive server 1.13.1 2 dc1 default <all> consul-server2 10.10.0.3:8301 alive server 1.13.1 2 dc1 default <all> consul-server3 10.10.0.4:8301 alive server 1.13.1 2 dc1 default <all> consul-client1 10.10.0.6:8301 alive client 1.13.1 2 dc1 default <default> consul-client2 10.10.0.5:8301 alive client 1.13.1 2 dc1 default <default>
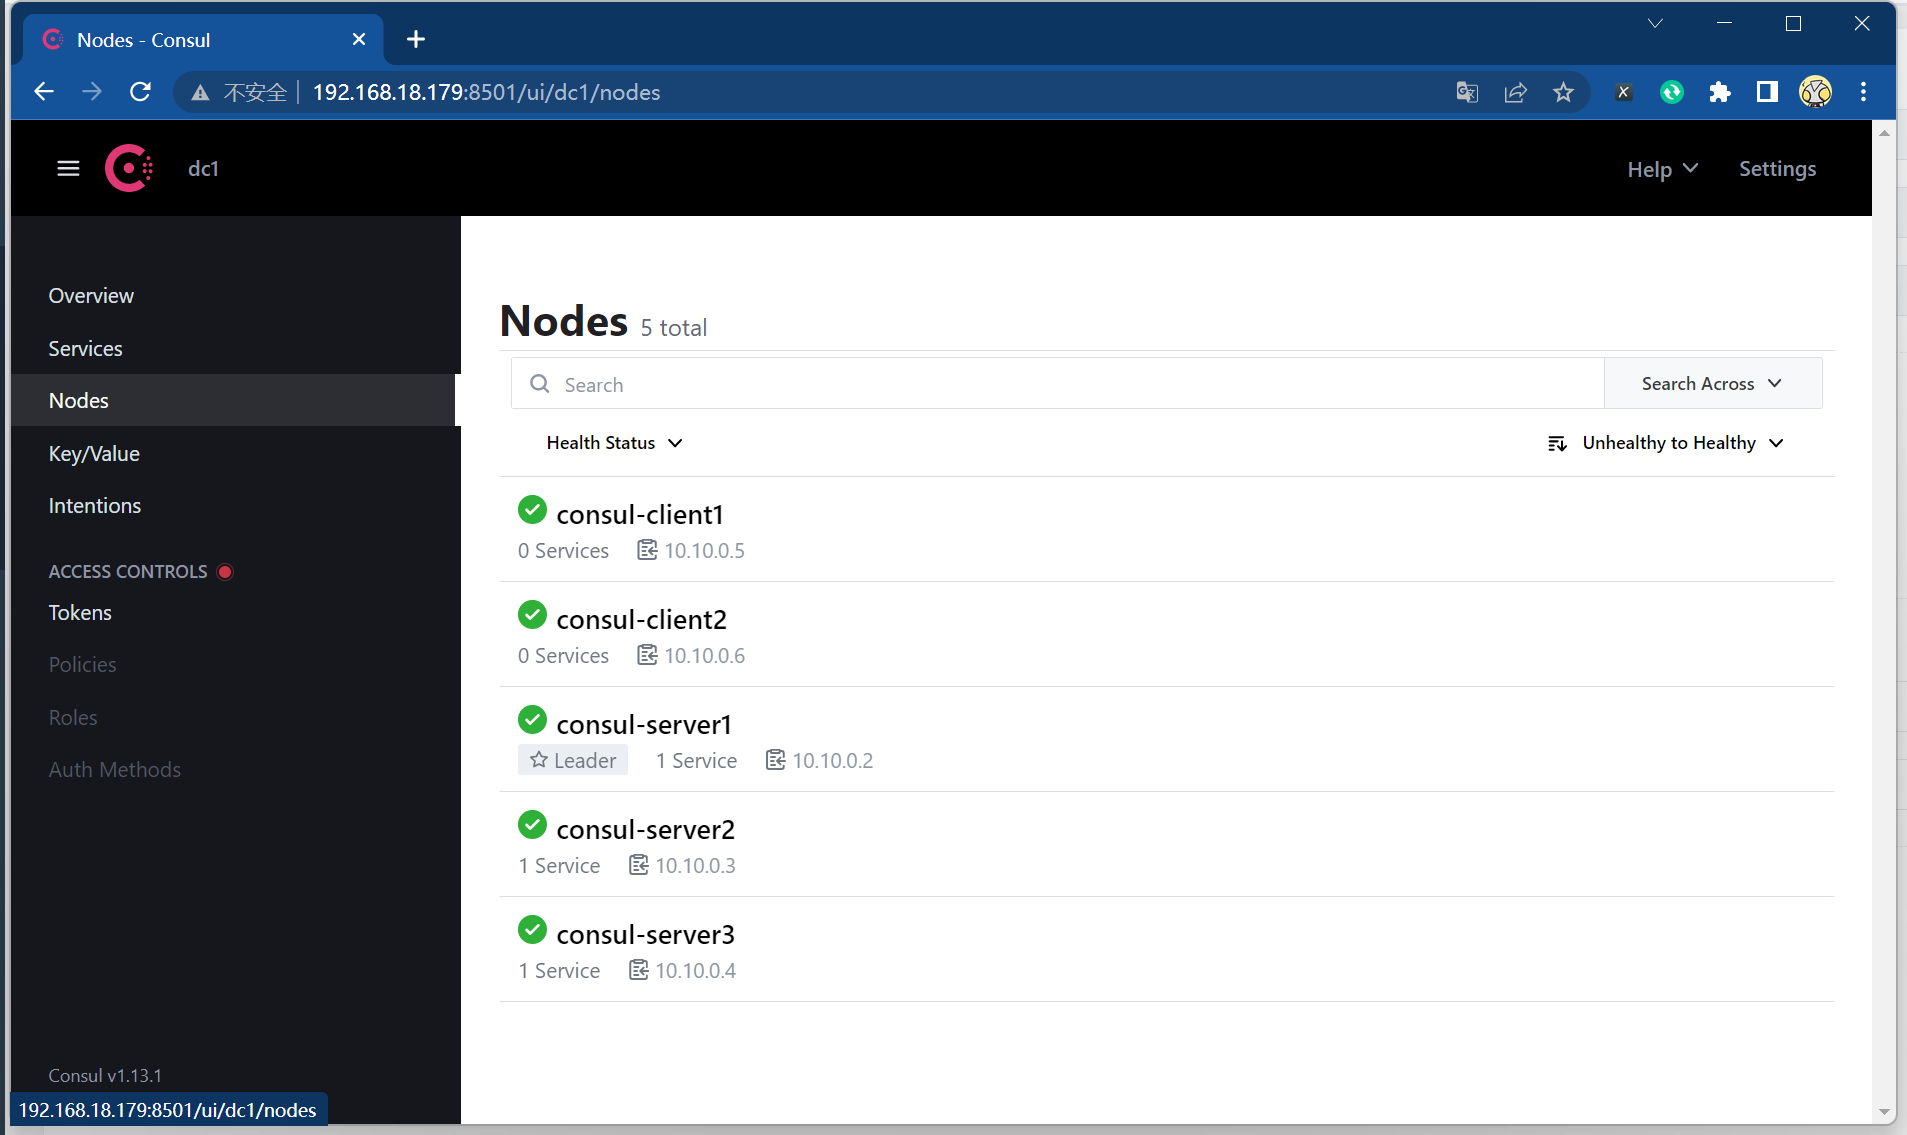
访问consul的web页面 http://192.168.18.179:8501/ui/dc1/overview/server-status
此时集群已经搭建完毕
将服务器的exporter注册到consul 在consul ui中可以看到以下结果
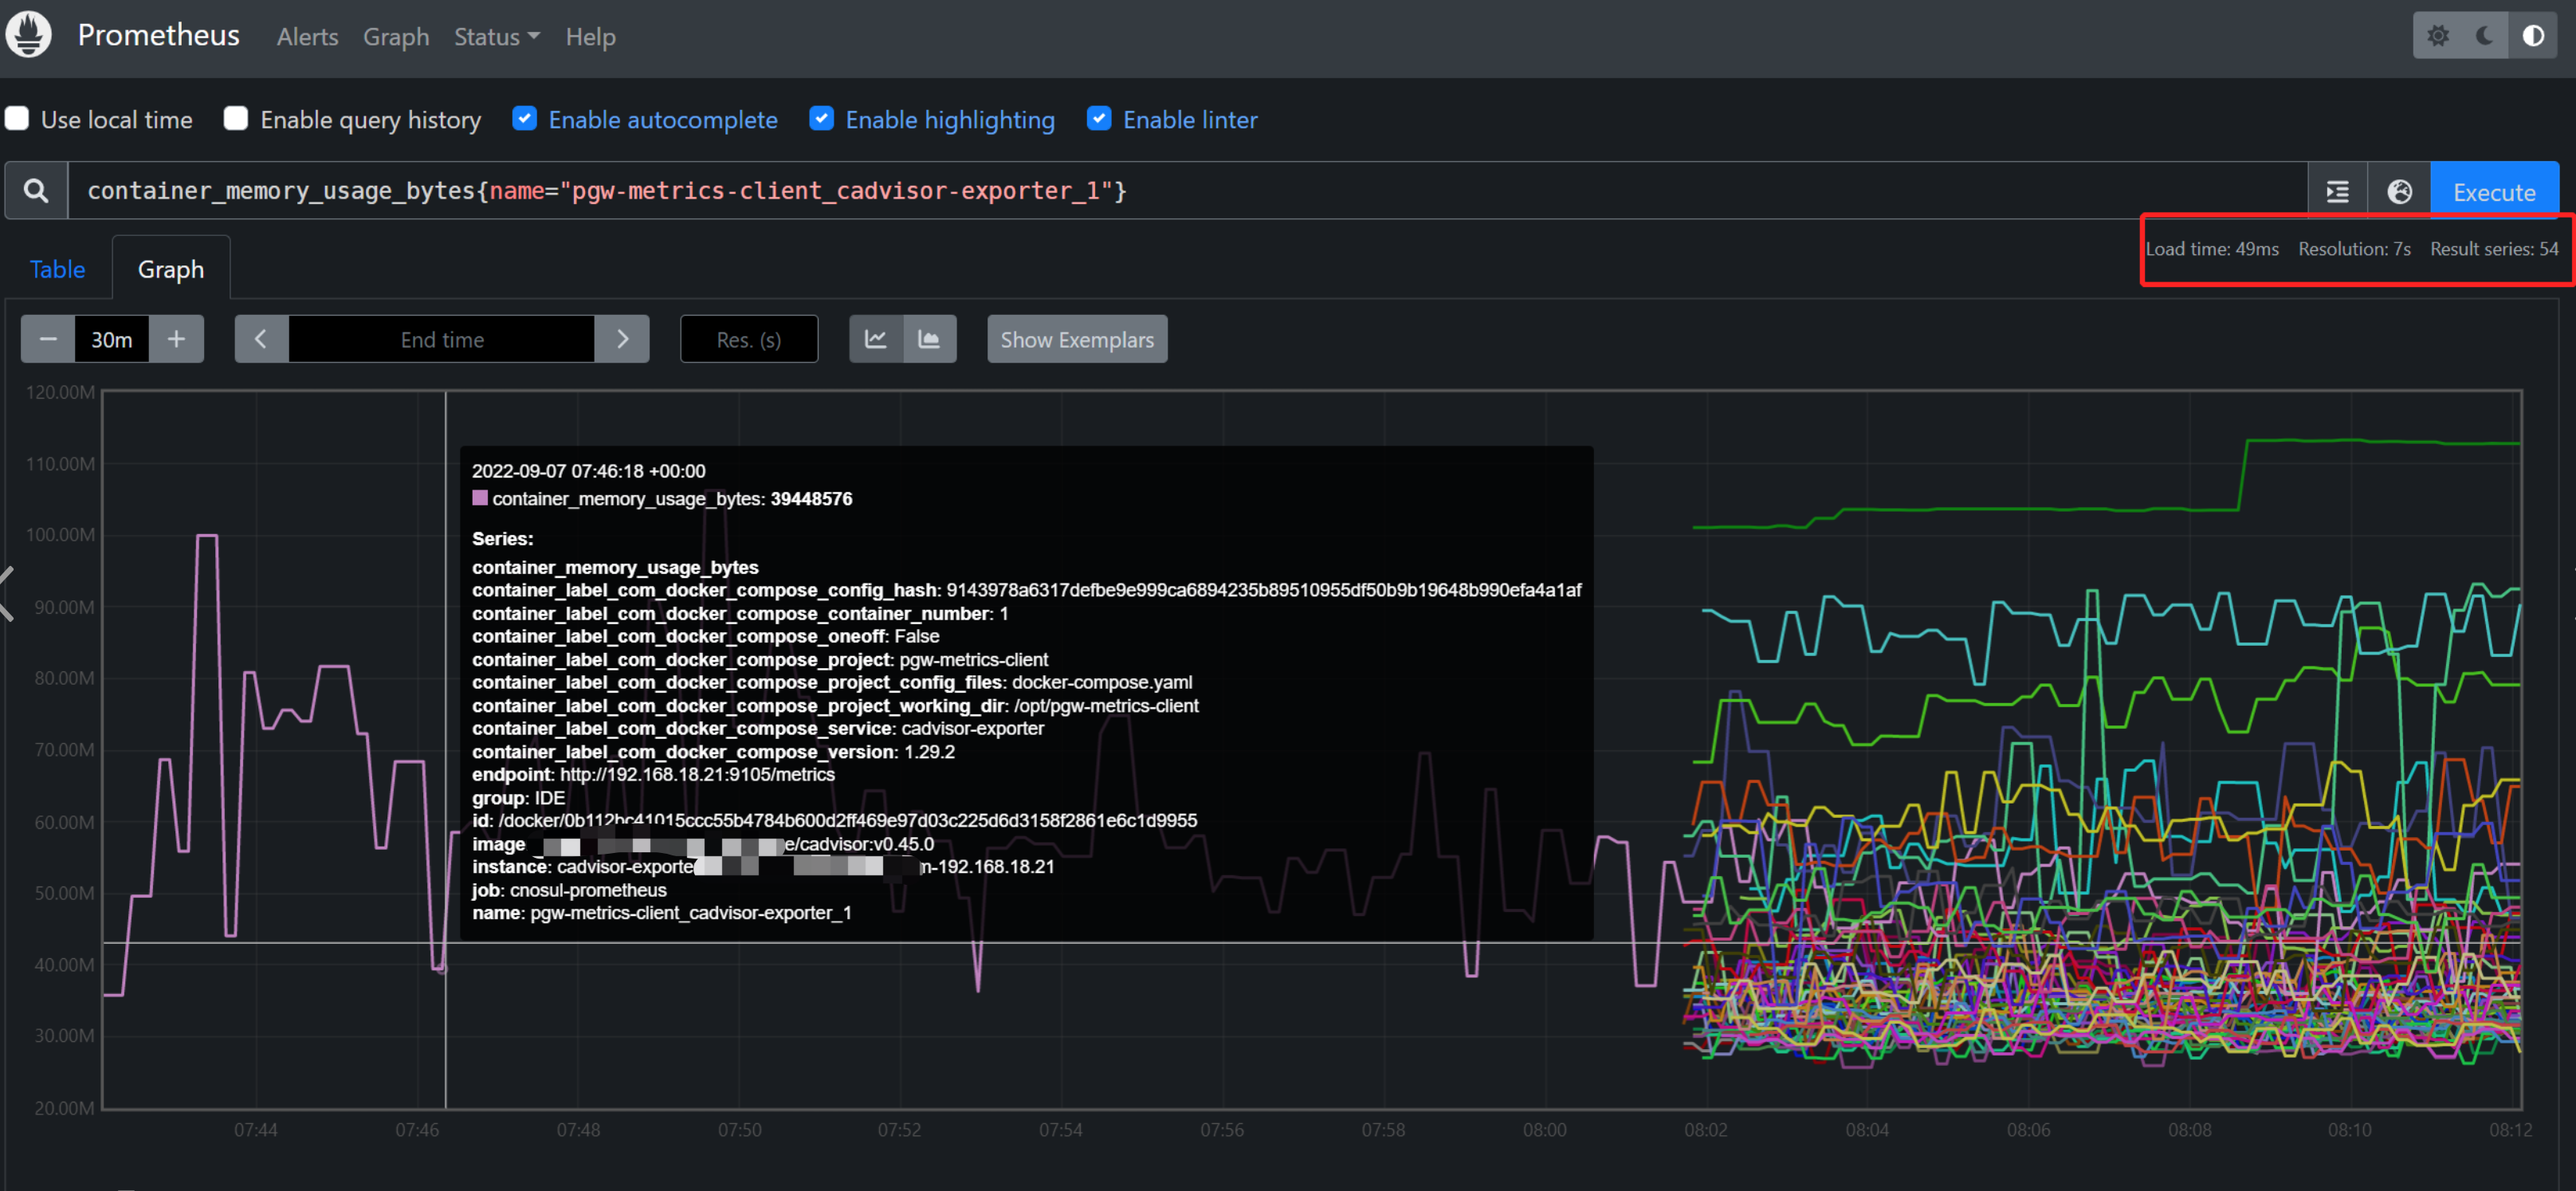
以上就是将191.168.18.21主机上的cadvisor服务注册到了consu上面,将这类服务的名称统称为 cadvisor-exporter ,因为服务实例id必须唯一,所以这里需要特殊定义一下 exporter type - 主机名 - ip地址
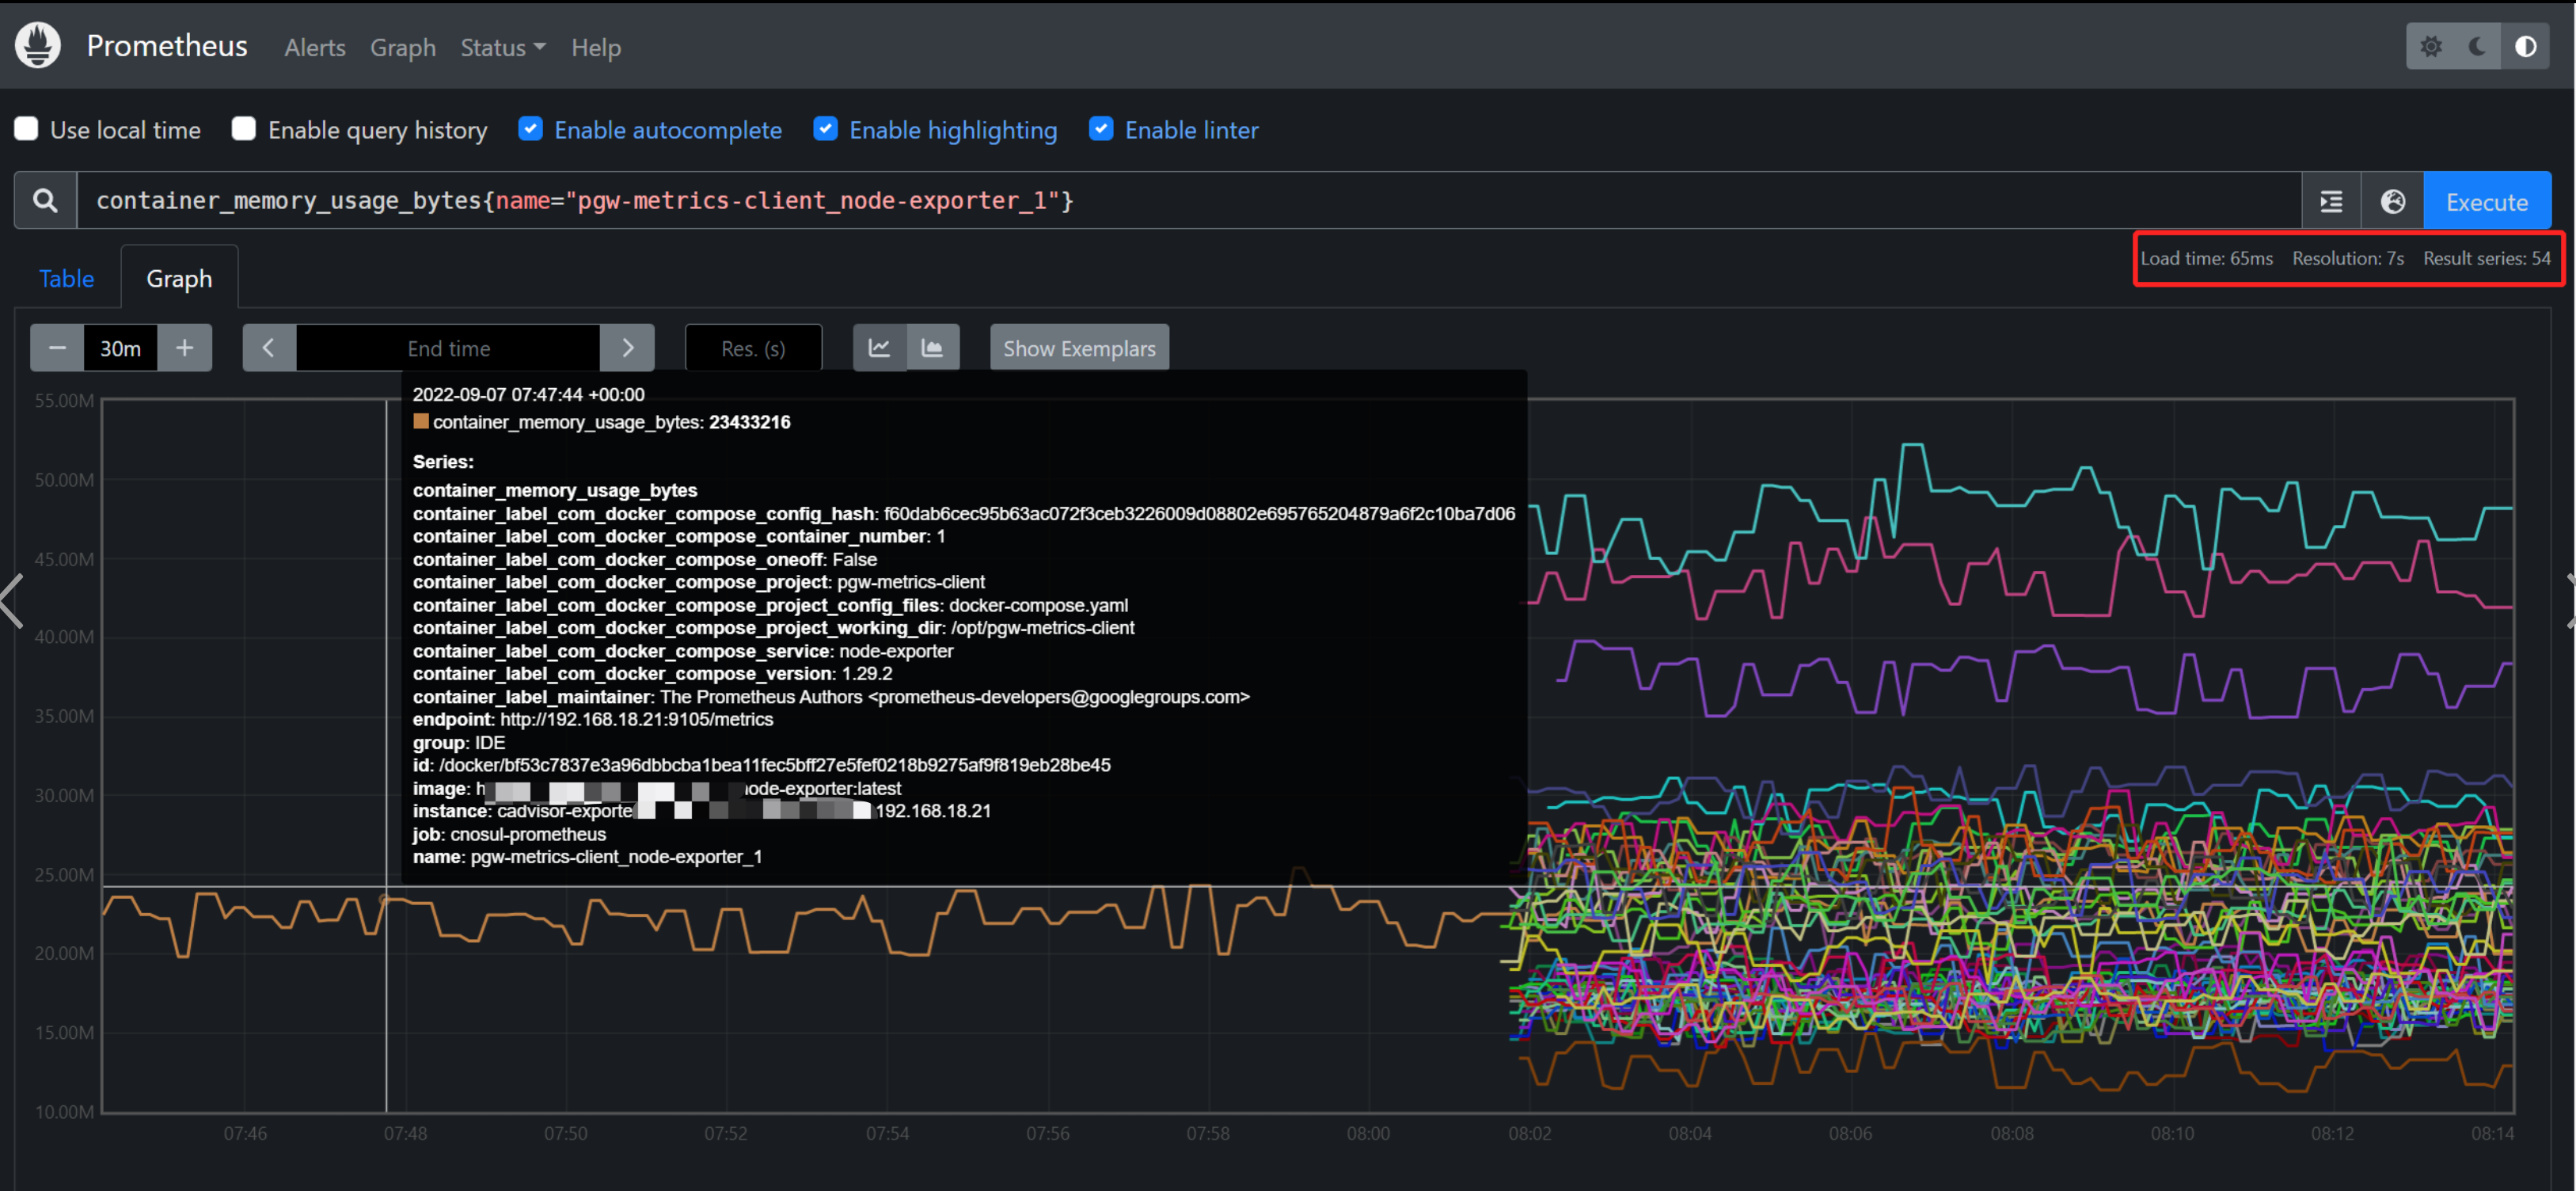
最后就是将两个epxorter都将21这台主机的两个exporter都注册到了consul.
配置promeheus 使其支持consul 1 2 3 4 5 6 7 8 9 10 11 12 13 14 15 16 17 18 19 20 21 22 23 24 25 26 27 28 29 30 31 32 ...... ...... ...... scrape_configs: - job_name: 'prometheus' scrape_interval: 15 s static_configs: - targets: ['localhost:9090 '] - job_name: "cnosul-prometheus" consul_sd_configs: - server: "192.168.18.178:8501" services: [] relabel_configs: - source_labels: [__meta_consul_service] regex: "consul" action: drop - source_labels: [__meta_consul_service_metadata_hostname] target_label: instance action: replace - source_labels: [__meta_consul_service_metadata_group] target_label: group action: replace - source_labels: [__scheme__, __address__, __metrics_path__] regex: "(http|https)(.*)" separator: "" target_label: "endpoint" replacement: "${1 } ://${2 } " action: replace ...... ...... ......
新增加以上配置以后重新加载配置promtheus服务
curl -I -X POST http://127.0.0.1:9090/-/reload
注意:prometheus开启api热加载,需要加上启动参数: –web.enable-lifecycle
consul注册服务/实例的时候就需要添加这两个元标签,再通过标签重新 为我们需要的label,便于后面prometheus/grafana使用
以上,通过配置 prometheus 为 consul_sd_configs,之后能够正确通过服务发现获取到两个服务得metircs url。
服务器众多的情况下,可以那么这里也可以通过脚本的方式去添加,因为consul有以下元标签,那么更容易使得我们的数据可控,例如上面我们在注册服务的时候加了一个 group ,hostname, consul传递到promtheus之后我们可以通过relable的方式去重写, 以上代表的就是这个主机属于哪个分组,后续可以作为grafan面板中,或者报警中的一个关键指标。
如何批量注册cadvisor/node exporter 到 consul consul 自身提供了API, 就像上面一样做成脚本以后,批量注册服务/实例即可:
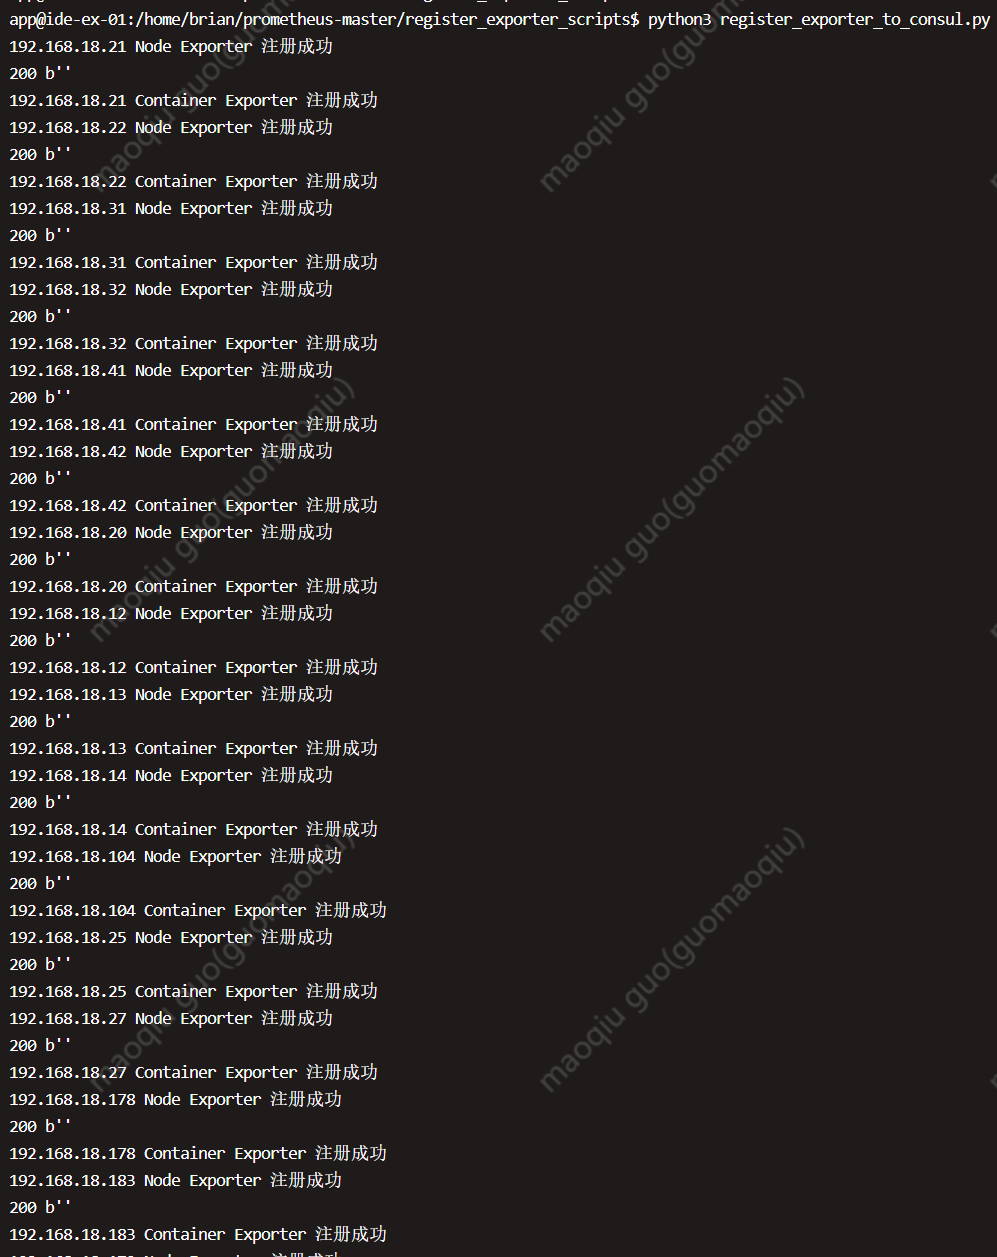
1 2 3 4 5 6 7 8 9 10 11 12 13 14 15 16 17 18 19 20 21 22 23 24 25 26 27 28 29 30 31 32 33 34 35 36 37 38 39 40 41 42 43 44 45 46 47 48 49 50 51 52 53 54 55 56 57 58 59 60 61 62 63 64 65 66 67 68 69 70 71 72 73 74 75 76 77 78 79 80 81 82 83 84 85 86 87 88 89 90 91 92 93 94 95 96 97 98 99 100 101 102 103 cat > register_exporter_to_consul.py << \EOF import json import requests import json consul_url = "http://192.168.18.179:8501/v1/agent/service/register" def register_node_exporter(ip,hostname,group): nodedata = { "id" : "node-exporter-{0}-{1}" .format(hostname,ip), # "id" : hostname, "name" : "node-exporter" , "address" : ip, "port" : 9100, "tags" : [], "meta" : { "hostname" : hostname, "group" : group "checks" : [ { "http" : "http://{0}:9100/metrics" .format(ip), "interval" : "5s" } ] } print (nodedata) try: r = requests.put(url =consul_url, data =json.dumps(nodedata)) if r.status_code == 200: print (ip, "Node Exporter 注册成功" ) else : print (ip, "Node Exporter 注册失败" ) except Exception as e: print (e) def register_container_exporter(ip,hostname,group): container_data = { "id" : "cadvisor-exporter-{0}-{1}" .format(hostname,ip), "name" : "cadvisor-exporter" , "address" : ip, "port" : 9105, "tags" : [], "meta" : { "hostname" : hostname, "group" : group "checks" : [ { "http" : "http://{0}:9105/metrics" .format(ip), "interval" : "5s" } ] } try: r = requests.put(url =consul_url, data =json.dumps(container_data)) print (r.status_code,r.content) if r.status_code == 200: print (ip, "Container Exporter 注册成功" ) else : print (ip, "Container Exporter 注册失败" ) except Exception as e: print (e) def register(): with open("server_list.txt" ,"r" ) as f: lines = (f.readlines()) for data in lines: ip = (str(data).split("\t" )[1].strip("\n" )) group = (str(data).split("\t" )[2].strip("\n" )) hostname = (str(data).split("\t" )[0]) register_node_exporter(ip =ip,hostname=hostname,group=group) register_container_exporter(ip =ip,hostname=hostname,group=group) register() EOF cat server_list.txt hostname1 192.168.18.21 IDE hostname2 192.168.18.22 IDE hostname3 192.168.18.31 IDE .. .. .. ... .. .. ... .. .. . python3 register_exporter_to_consul.py
执行以上脚本以后就可以在consul以及promtheus web页面进行查看检验了:
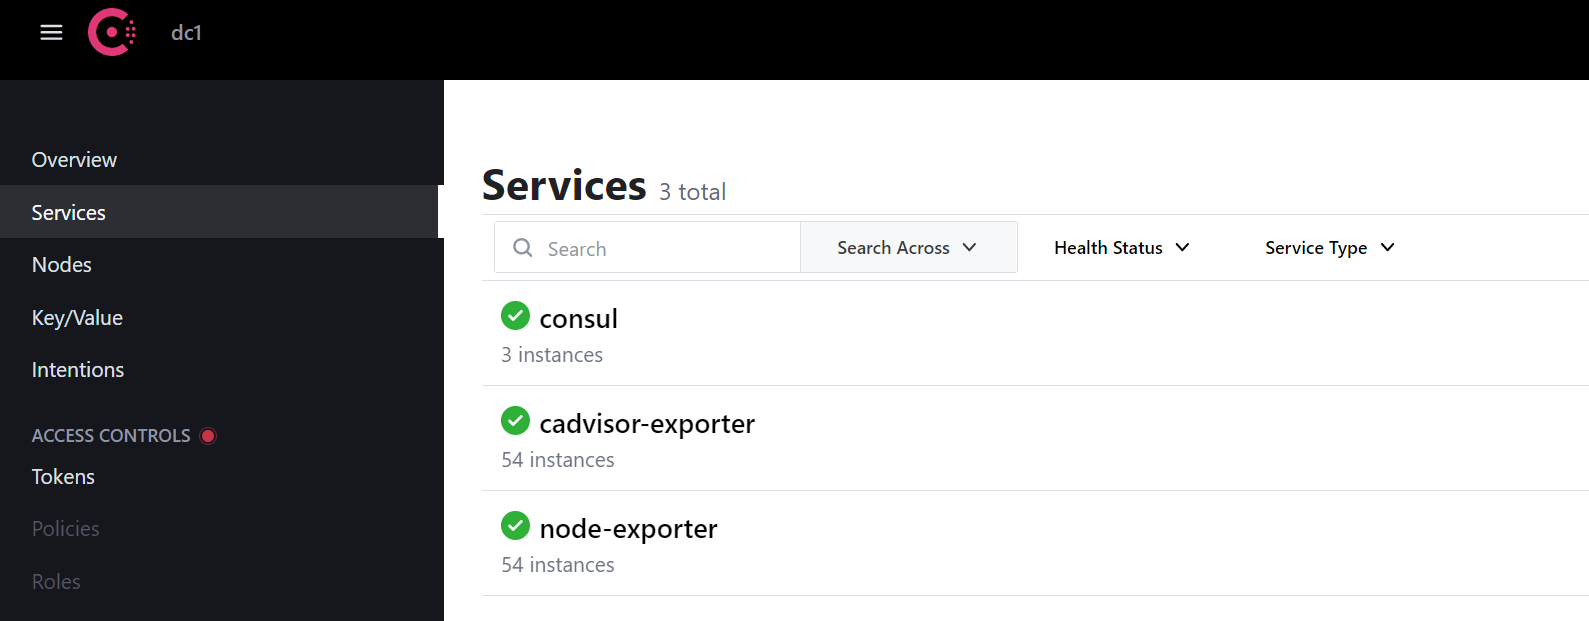
从上面可以看到已经注册了54个,但是这其实只添加了27台服务器而已,因为每台服务器上面运行了两个exporter,一个是node-exporter,一个是cadvisor-exporter, 他们有各自的metrics URL ,最后再到prometheus检查是否添加即可。
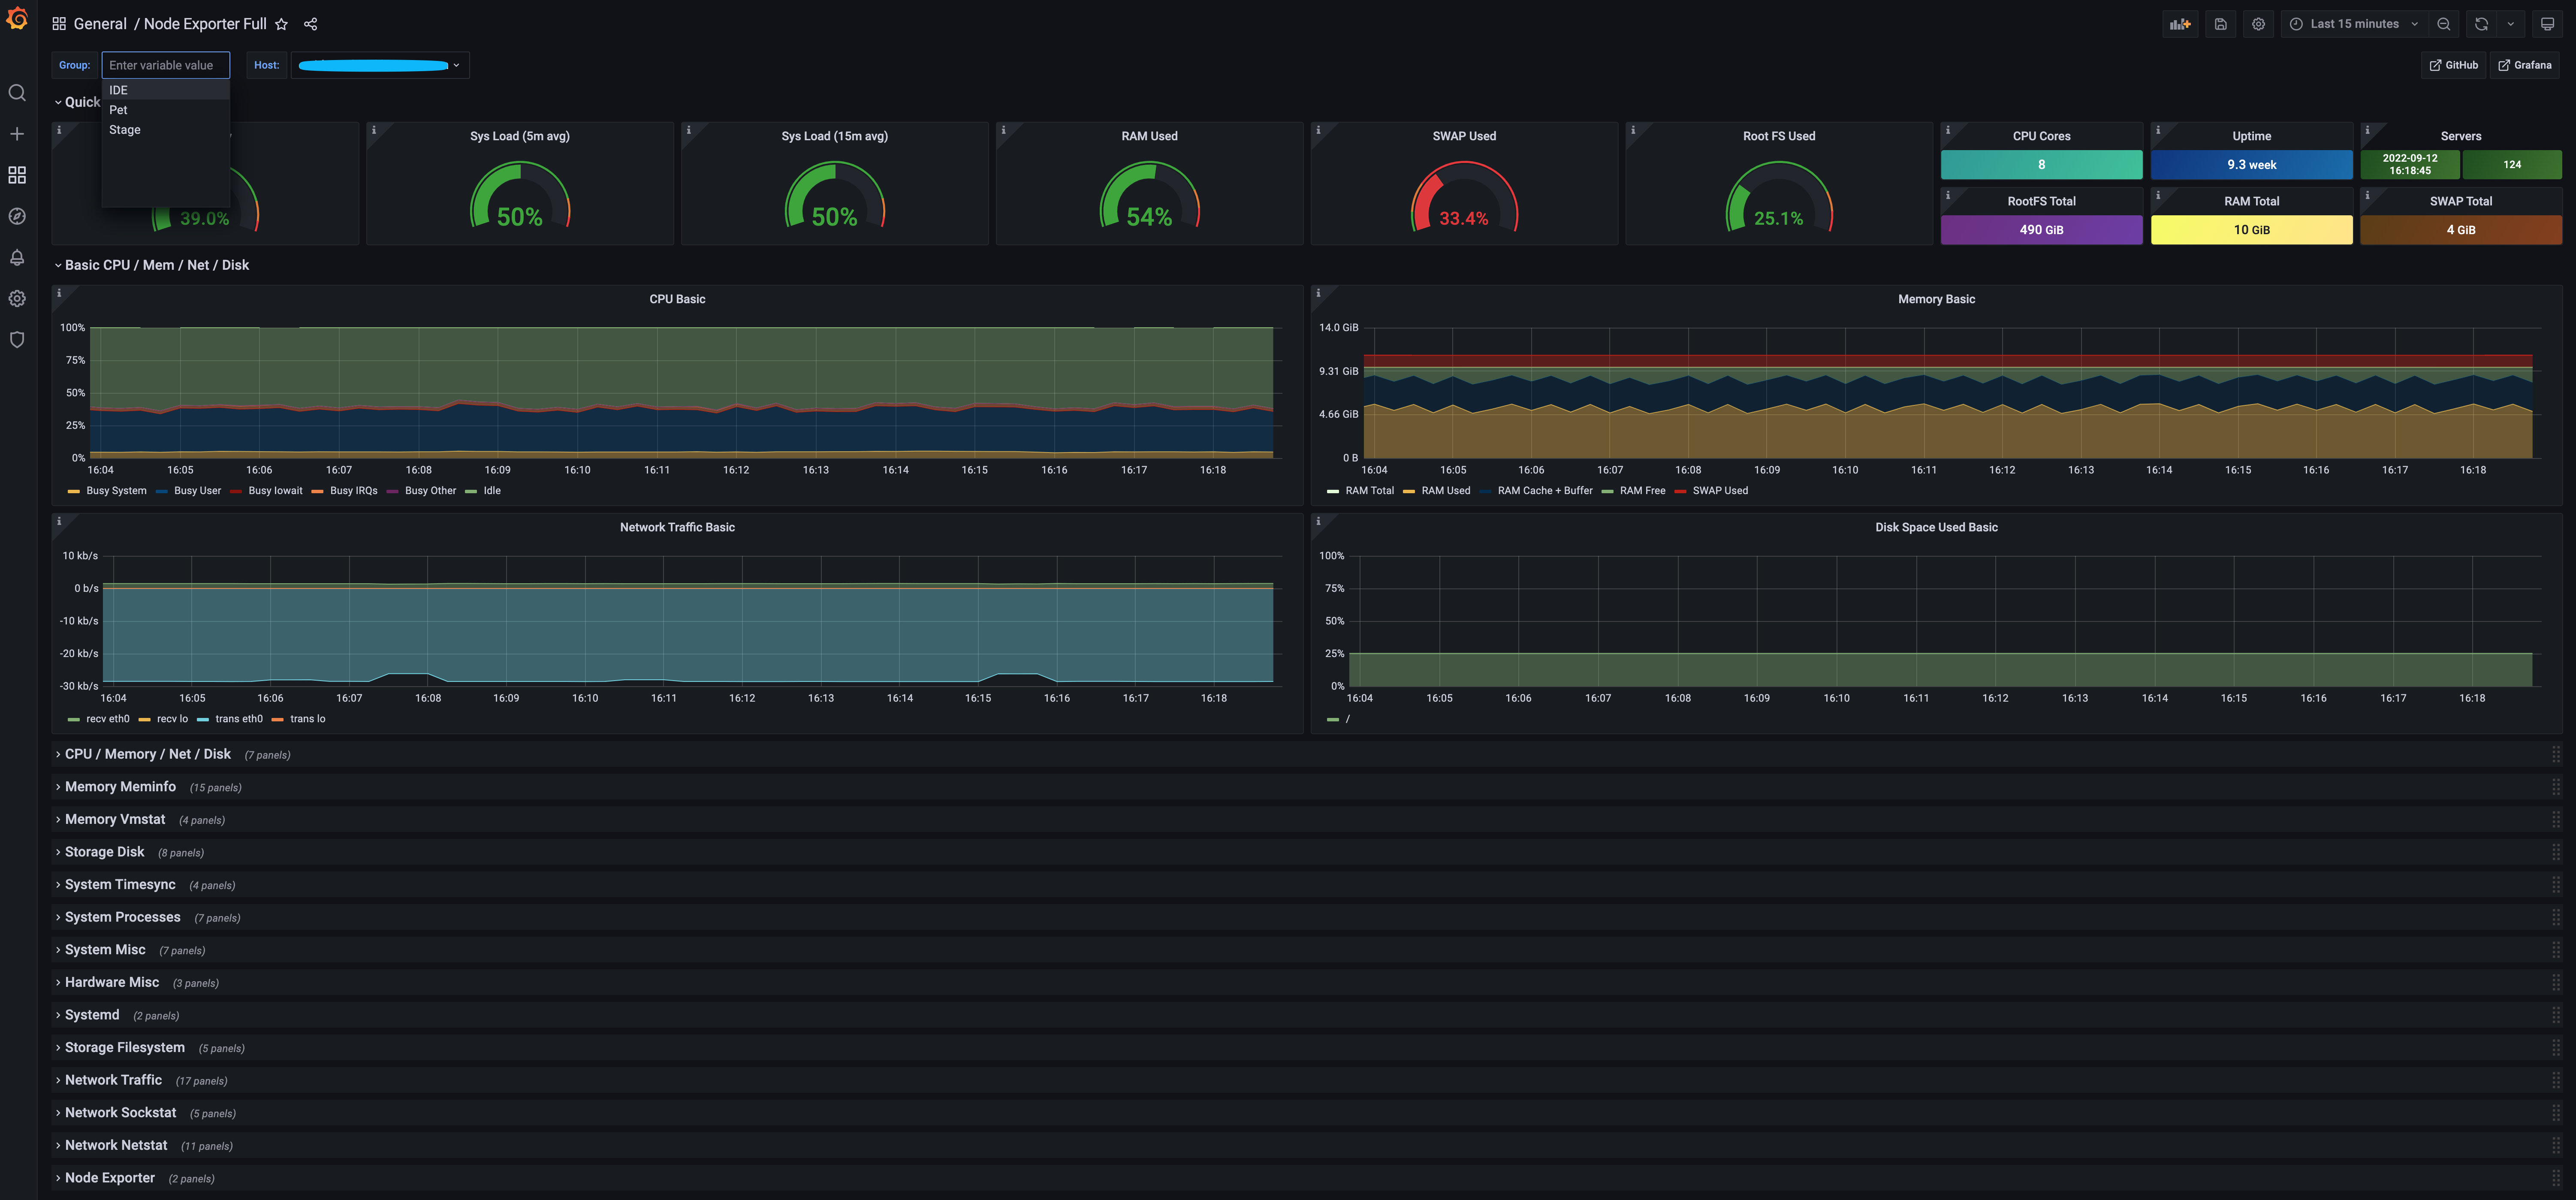
至此,consul的部署,服务/实例的注册,promtheus的consul_sd_configs服务自动发现 ,数据采集已经完成,后续就是将prometheus 接入到 grafana:
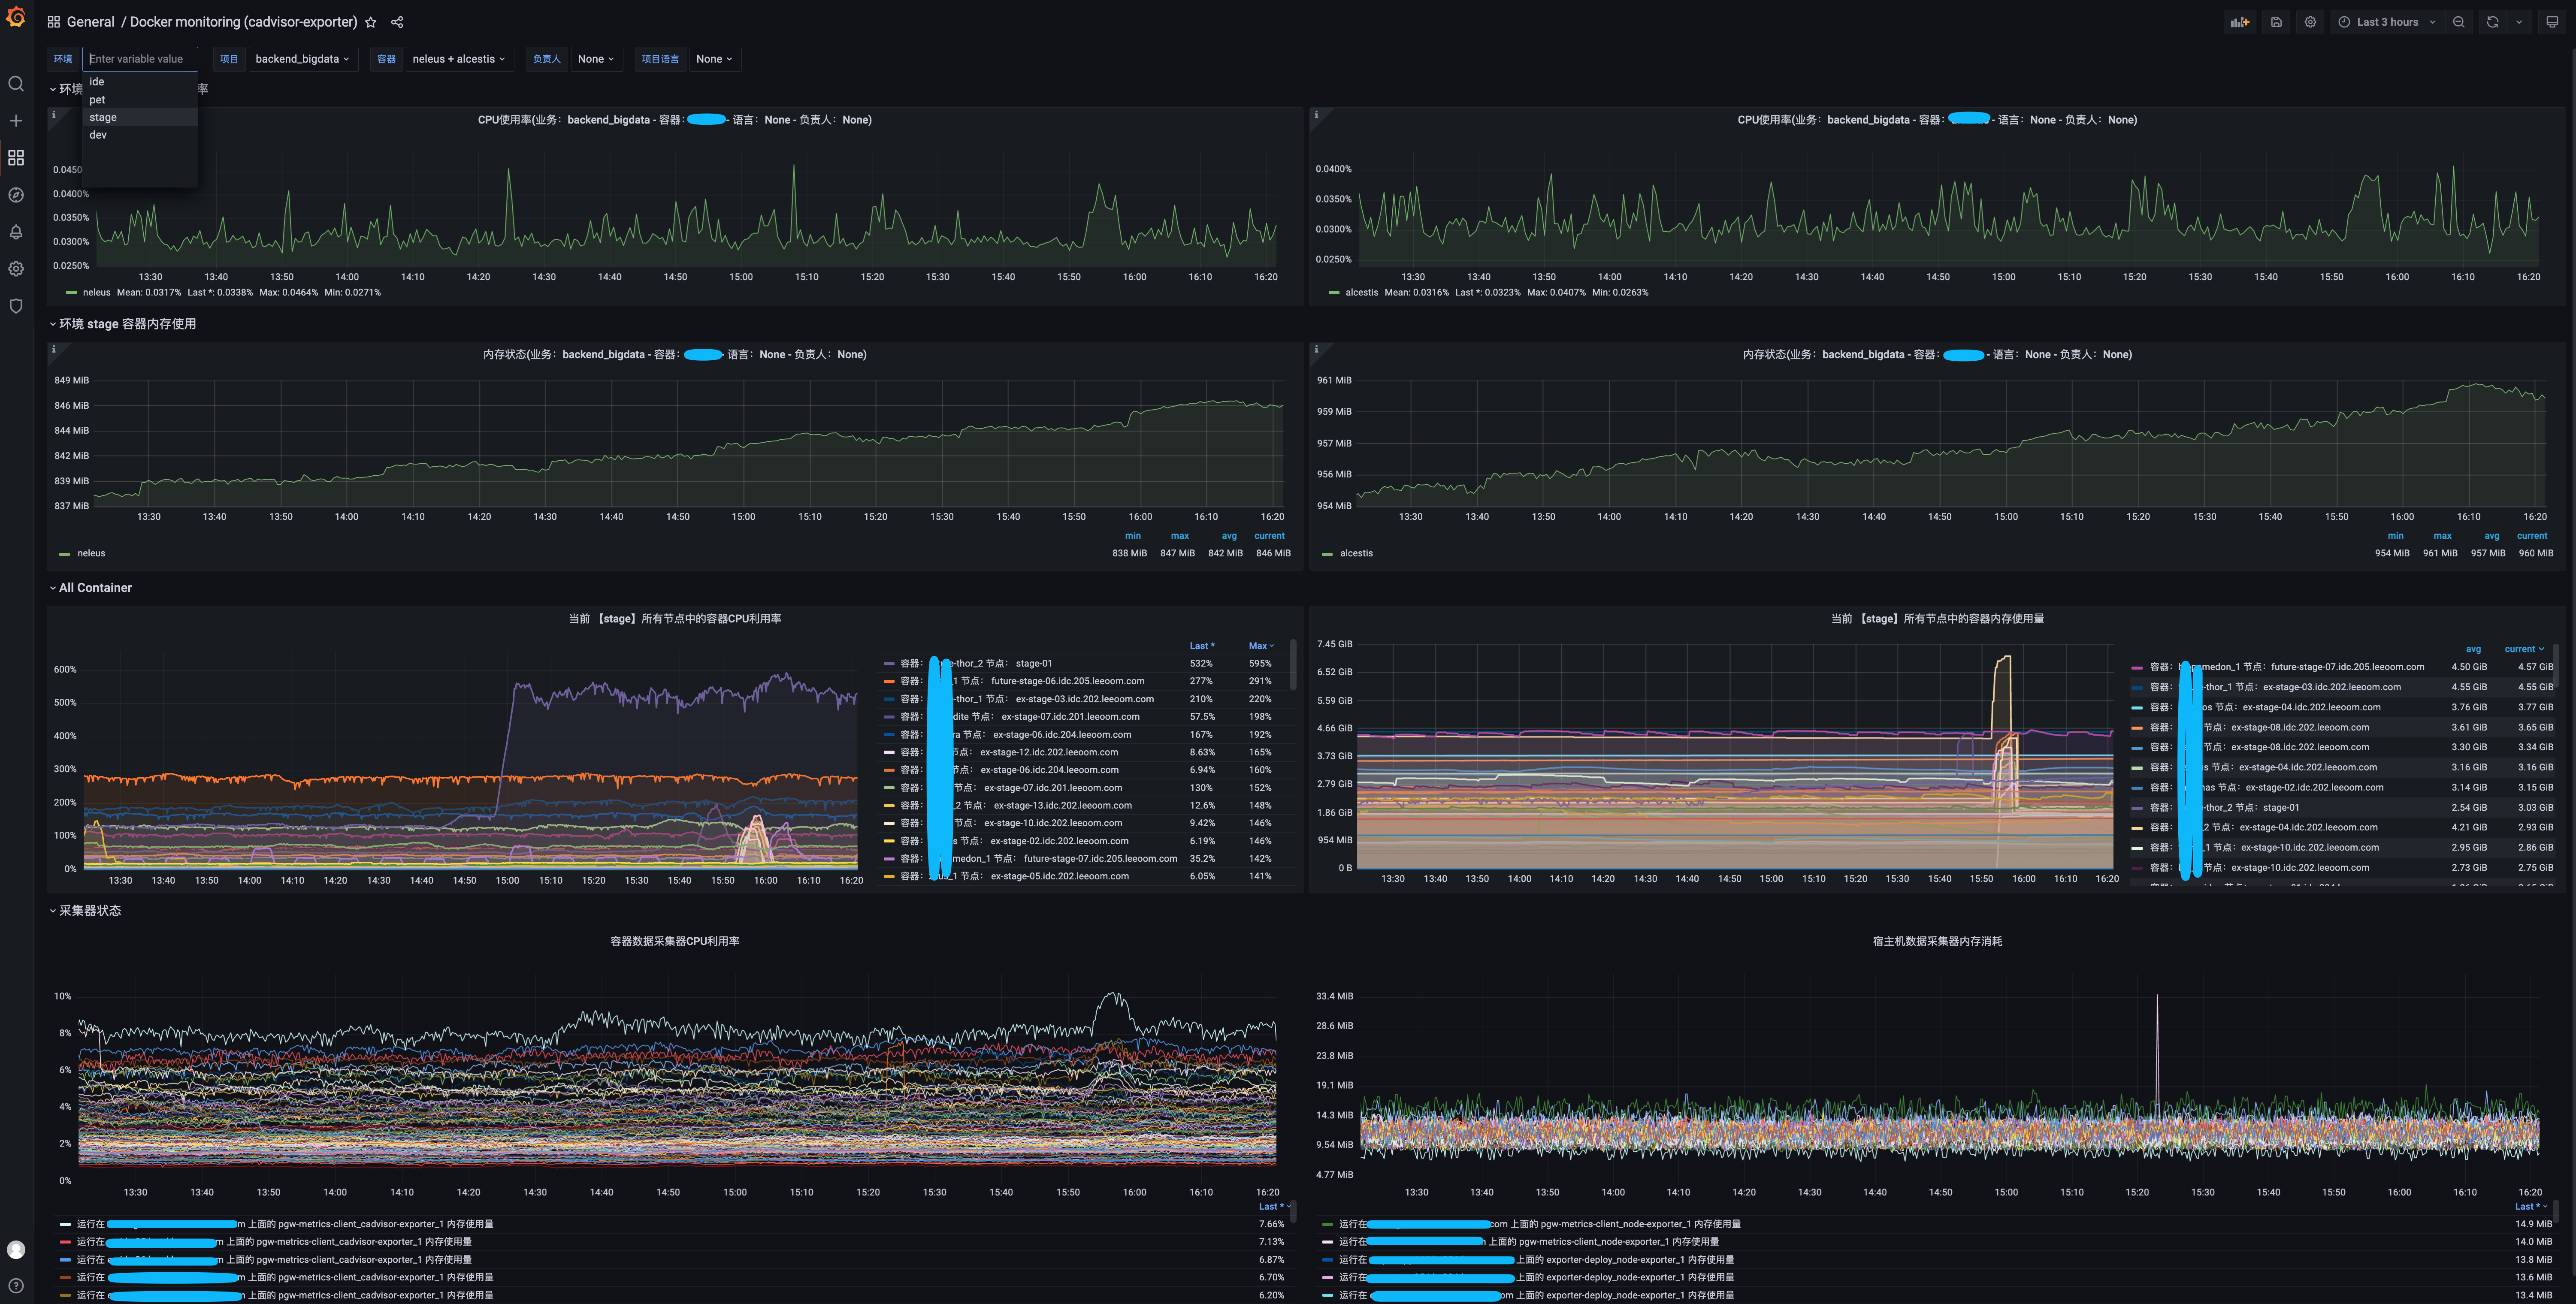
上图中可以看到通过自定义的label进行分组
告警系统接入 已经可以看到容器&宿主机的数据已经正常采集并且已经能够在grafan面板上进行展示
报警系统使用的是Alertmanager 搭配 Webhook来实现:
alertmanager配置 1 2 3 4 5 6 7 8 9 10 11 12 13 14 15 16 17 18 19 20 21 22 23 24 25 26 27 28 29 30 31 32 33 34 35 36 37 38 39 40 41 42 43 44 cat > alertmanager/config.yml < < EOF global: resolve_timeout: 10 m inhibit_rules: - source_match: alertname: 'critical' target_match: alertname: 'warning' equal: ['alertname'] route: receiver: default-receiver group_wait: 30 s group_interval: 5 m repeat_interval: 3 h group_by: ['alertname'] routes: - receiver: webhook-ide matchers: - group = IDE - receiver: webhook-stage matchers: - group = Stage - receiver: webhook-Pet matchers: - group = Pet receivers: - name: default-receiver - name: webhook-ide webhook_configs: - url: 'http:// 192.168 .18.178 :9060 / dingtalk/ webhook-ide/ send' send_resolved: true - name: webhook-stage webhook_configs: - url: 'http:// 192.168 .18.178 :9060 / dingtalk/ webhook-stage/ send' send_resolved: true - name: webhook-Pet webhook_configs: - url: 'http:// 192.168 .18.178 :9060 / dingtalk/ webhook-Pet/ send' send_resolved: true EOF
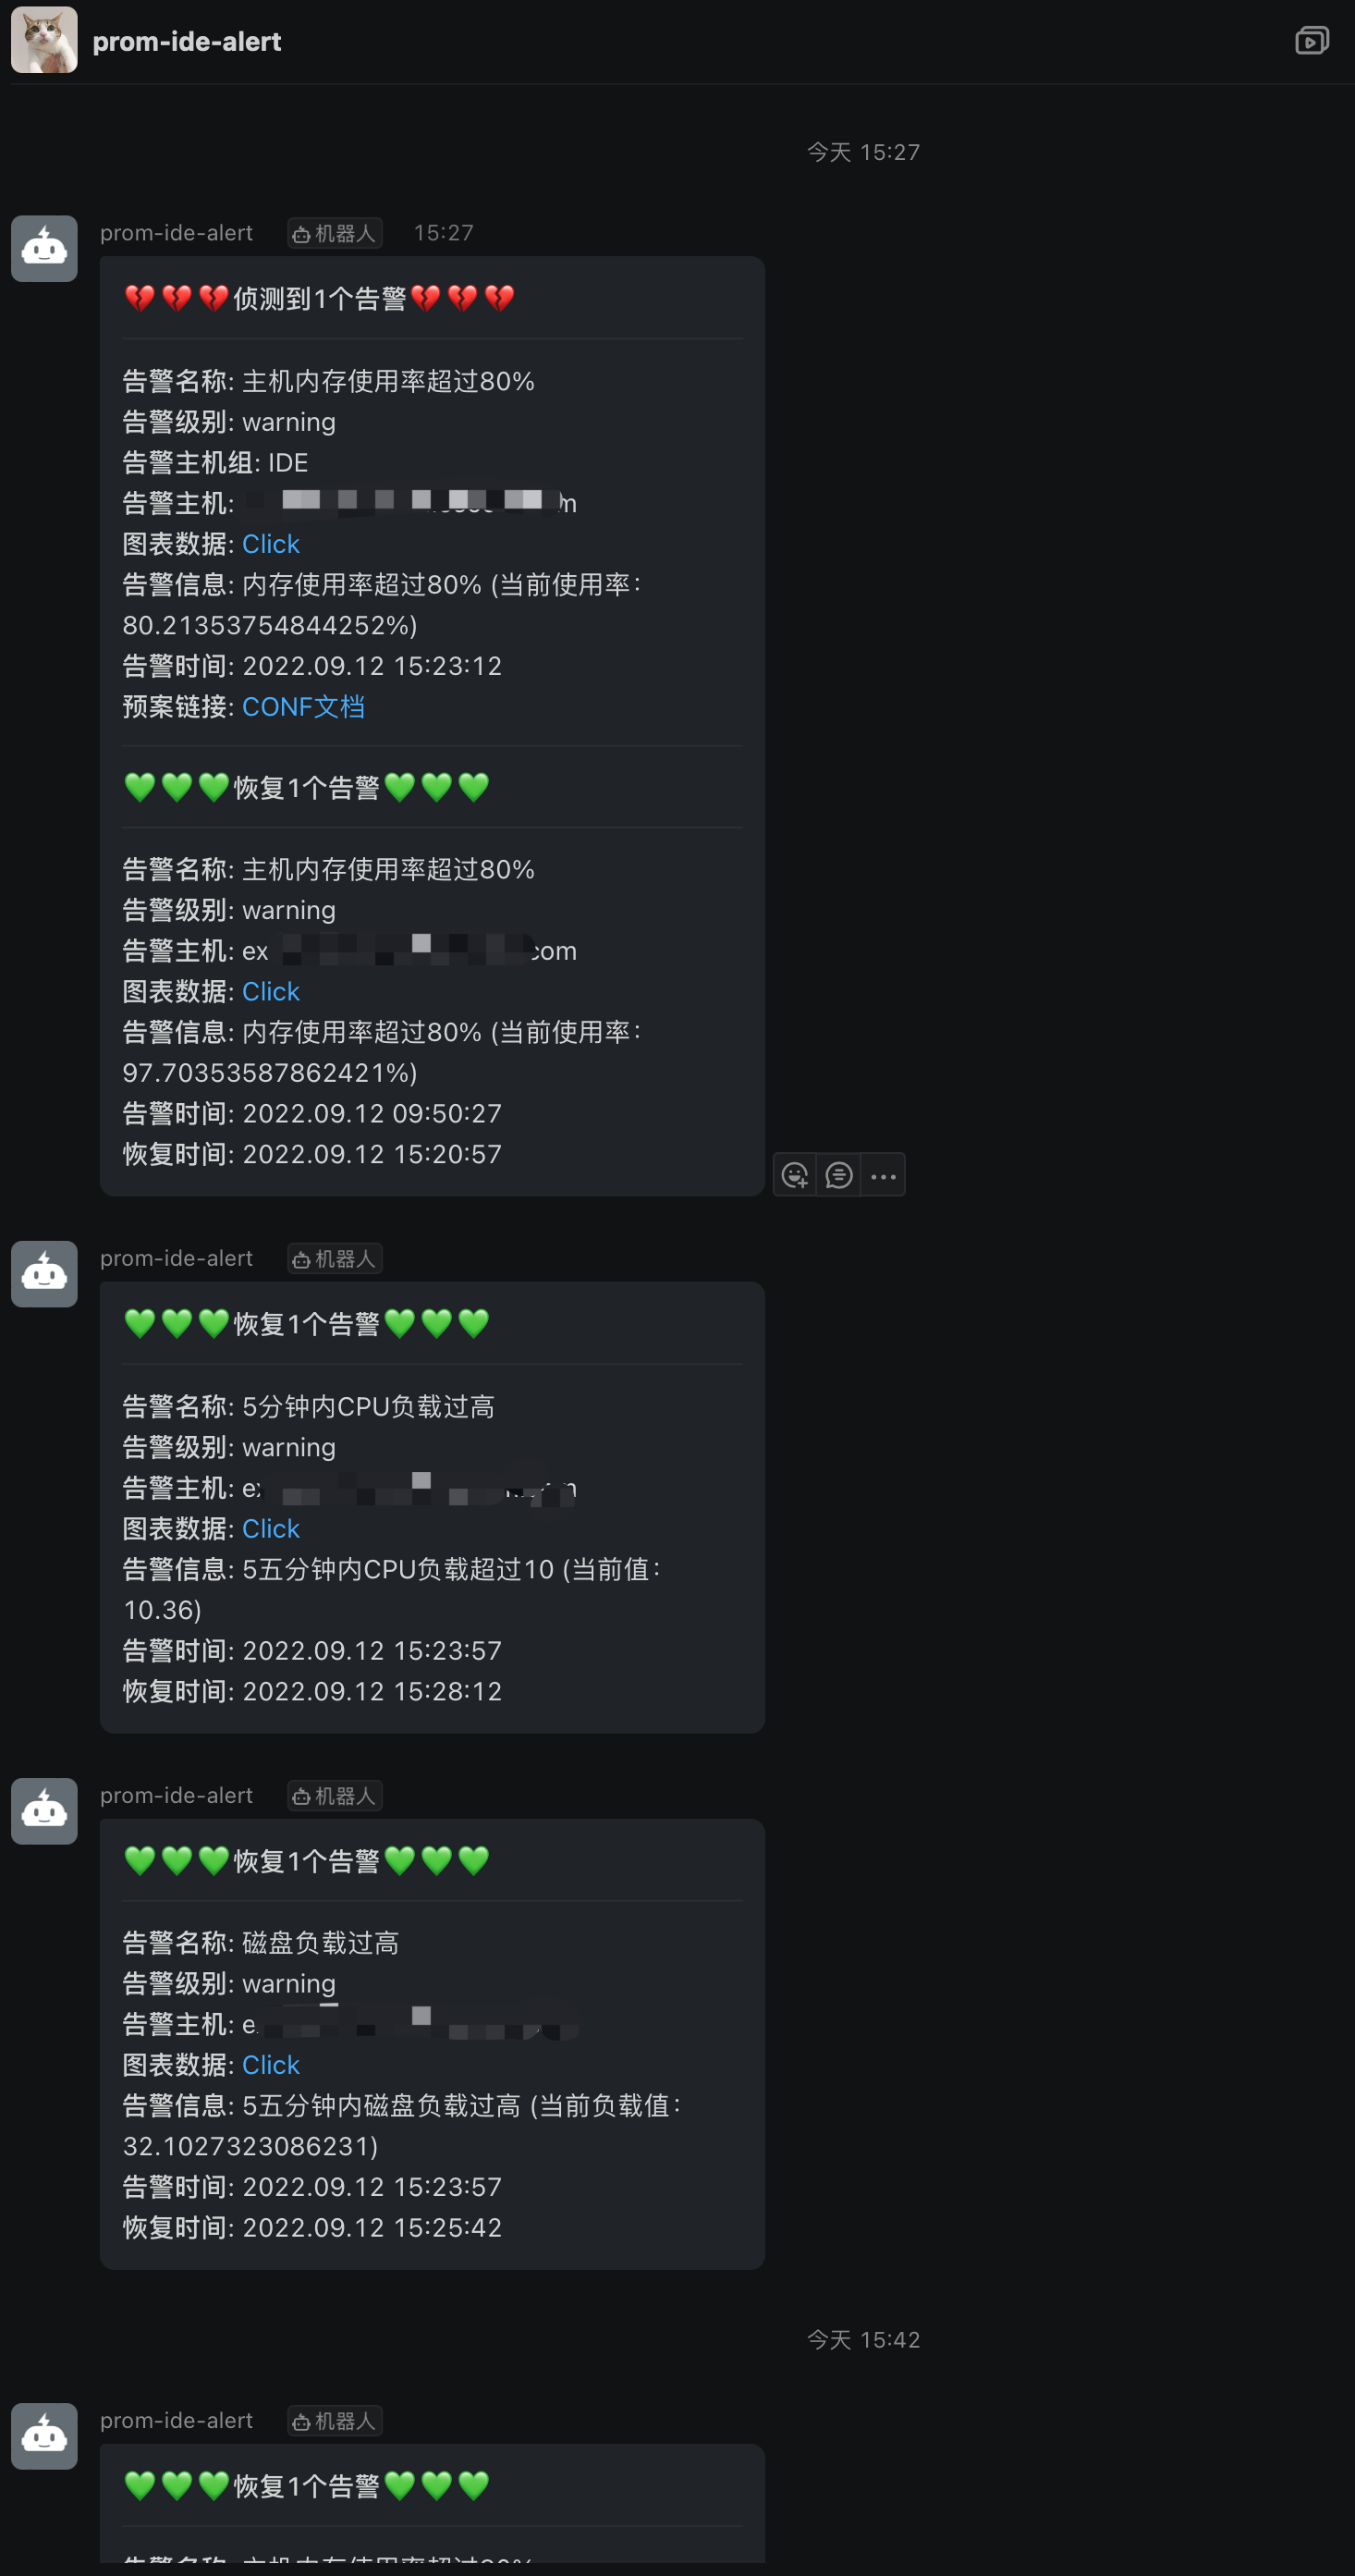
dingding-webhook配置 这里按照环境进行了分组,将不同的告警信息通过环境发送到不同的钉钉群
1 2 3 4 5 6 7 8 9 10 11 12 13 14 15 16 17 18 19 20 21 22 23 24 25 26 27 28 29 30 31 32 33 34 35 36 37 38 cat > prometheus-dingding-webhook/config.yml < < EOF templates: - /config/template.tmpl targets: webhook1: url: https:// oapi.dingtalk.com/ robot/ send? access_token= 92268 cd2c48db0ec2a10a753213dda6a11e4d54ea8fdbce356f217fa44925a7f secret: 填写你的钉钉secret webhook-ide: url: https:// oapi.dingtalk.com/ robot/ send? access_token= 92268 cd2c48db0ec2a10a753213dda6a11e4d54ea8fdbce356f217fa44925a7f secret: 填写你的钉钉secret webhook-stage: url: https:// oapi.dingtalk.com/ robot/ send? access_token= 9 d7172785d72f50ab335367bd7db8cb013073f62bd0fd7bfc9605020a6a4b95c secret: 填写你的钉钉secret webhook-Pet: url: https:// oapi.dingtalk.com/ robot/ send? access_token= 89 b881f5798ec7cdff1538ecf3a7001dd30d19c7e5281e5e8329cb1e243b813e secret: 你的钉钉secret EOF
这里还自定义了报警模板,上述文件中需要引入:
1 2 3 4 5 6 7 8 9 10 11 12 13 14 15 16 17 18 19 20 21 22 23 24 25 26 27 28 29 30 31 32 33 34 35 36 37 38 39 40 41 42 43 44 45 46 47 48 49 50 51 52 53 54 55 56 57 58 59 60 61 62 63 64 65 66 67 cat > dingding.tmpl << EOF {{ define "__subject" }} [ {{ .Status | toUpper }} {{ if "firing" }} : {{ .Alerts.Firing | len }} {{ end }} ] {{ end }} {{ define "__alert_list" }} {{ range . }} --- **告警名称**: {{ index .Annotations "title" }} **告警级别**: {{ .Labels.severity }} **告警主机组**: {{ .Labels.group }} **告警主机**: {{ .Labels.instance }} **图表数据**: [Click]( {{ .GeneratorURL }} ) **告警信息**: {{ index .Annotations "description" }} **告警时间**: {{ dateInZone "2006.01.02 15:04:05" (.StartsAt ) "Asia/Shanghai" }} **预案链接**: [CONF文档]( {{ index .Annotations "plan_url" }} ) {{ end }} {{ end }} {{ define "__resolved_list" }} {{ range . }} --- **告警名称**: {{ index .Annotations "title" }} **告警级别**: {{ .Labels.severity }} **告警主机**: {{ .Labels.instance }} **图表数据**: [Click]( {{ .GeneratorURL }} ) **告警信息**: {{ index .Annotations "description" }} **告警时间**: {{ dateInZone "2006.01.02 15:04:05" (.StartsAt ) "Asia/Shanghai" }} **恢复时间**: {{ dateInZone "2006.01.02 15:04:05" (.EndsAt ) "Asia/Shanghai" }} {{ end }} {{ end }} {{ define "default.title" }} {{ template "__subject" . }} {{ end }} {{ define "default.content" }} {{ if len .Alerts.Firing) 0 }} **💔💔💔侦测到 {{ .Alerts.Firing | len }} 个告警💔💔💔** {{ template "__alert_list" .Alerts.Firing }} --- {{ end }} {{ if len .Alerts.Resolved) 0 }} **💚💚💚恢复 {{ .Alerts.Resolved | len }} 个告警💚💚💚** {{ template "__resolved_list" .Alerts.Resolved }} {{ end }} {{ end }} {{ define "ding.link.title" }} {{ template "default.title" . }} {{ end }} {{ define "ding.link.content" }} {{ template "default.content" . }} {{ end }} {{ template "default.title" . }} {{ template "default.content" . }} EOF
这里需要注意的是,这个模板中我们加了自定义的一些自己想要的东西:
需要在告警的时候加上针对每个告警的日常处理方式的一个预案,那么这个就给出一个文档的链接就行了,日常运维人员看到告警之后,一般都会进行一个故障处理过程或记录吧,这样能更加友好。那如何定义?plan_url:
Prometheus中需要开启 外部url 访问,即在启动的时候加入参数- '--web.external-url=http://192.168.18.178:9090', 否则告警模板中的 .GeneratorURL 这个值应用的是prometheus的主机名,即运行prometheus的那个容器的主机名,那样访问是访问不到的,所以需要修改
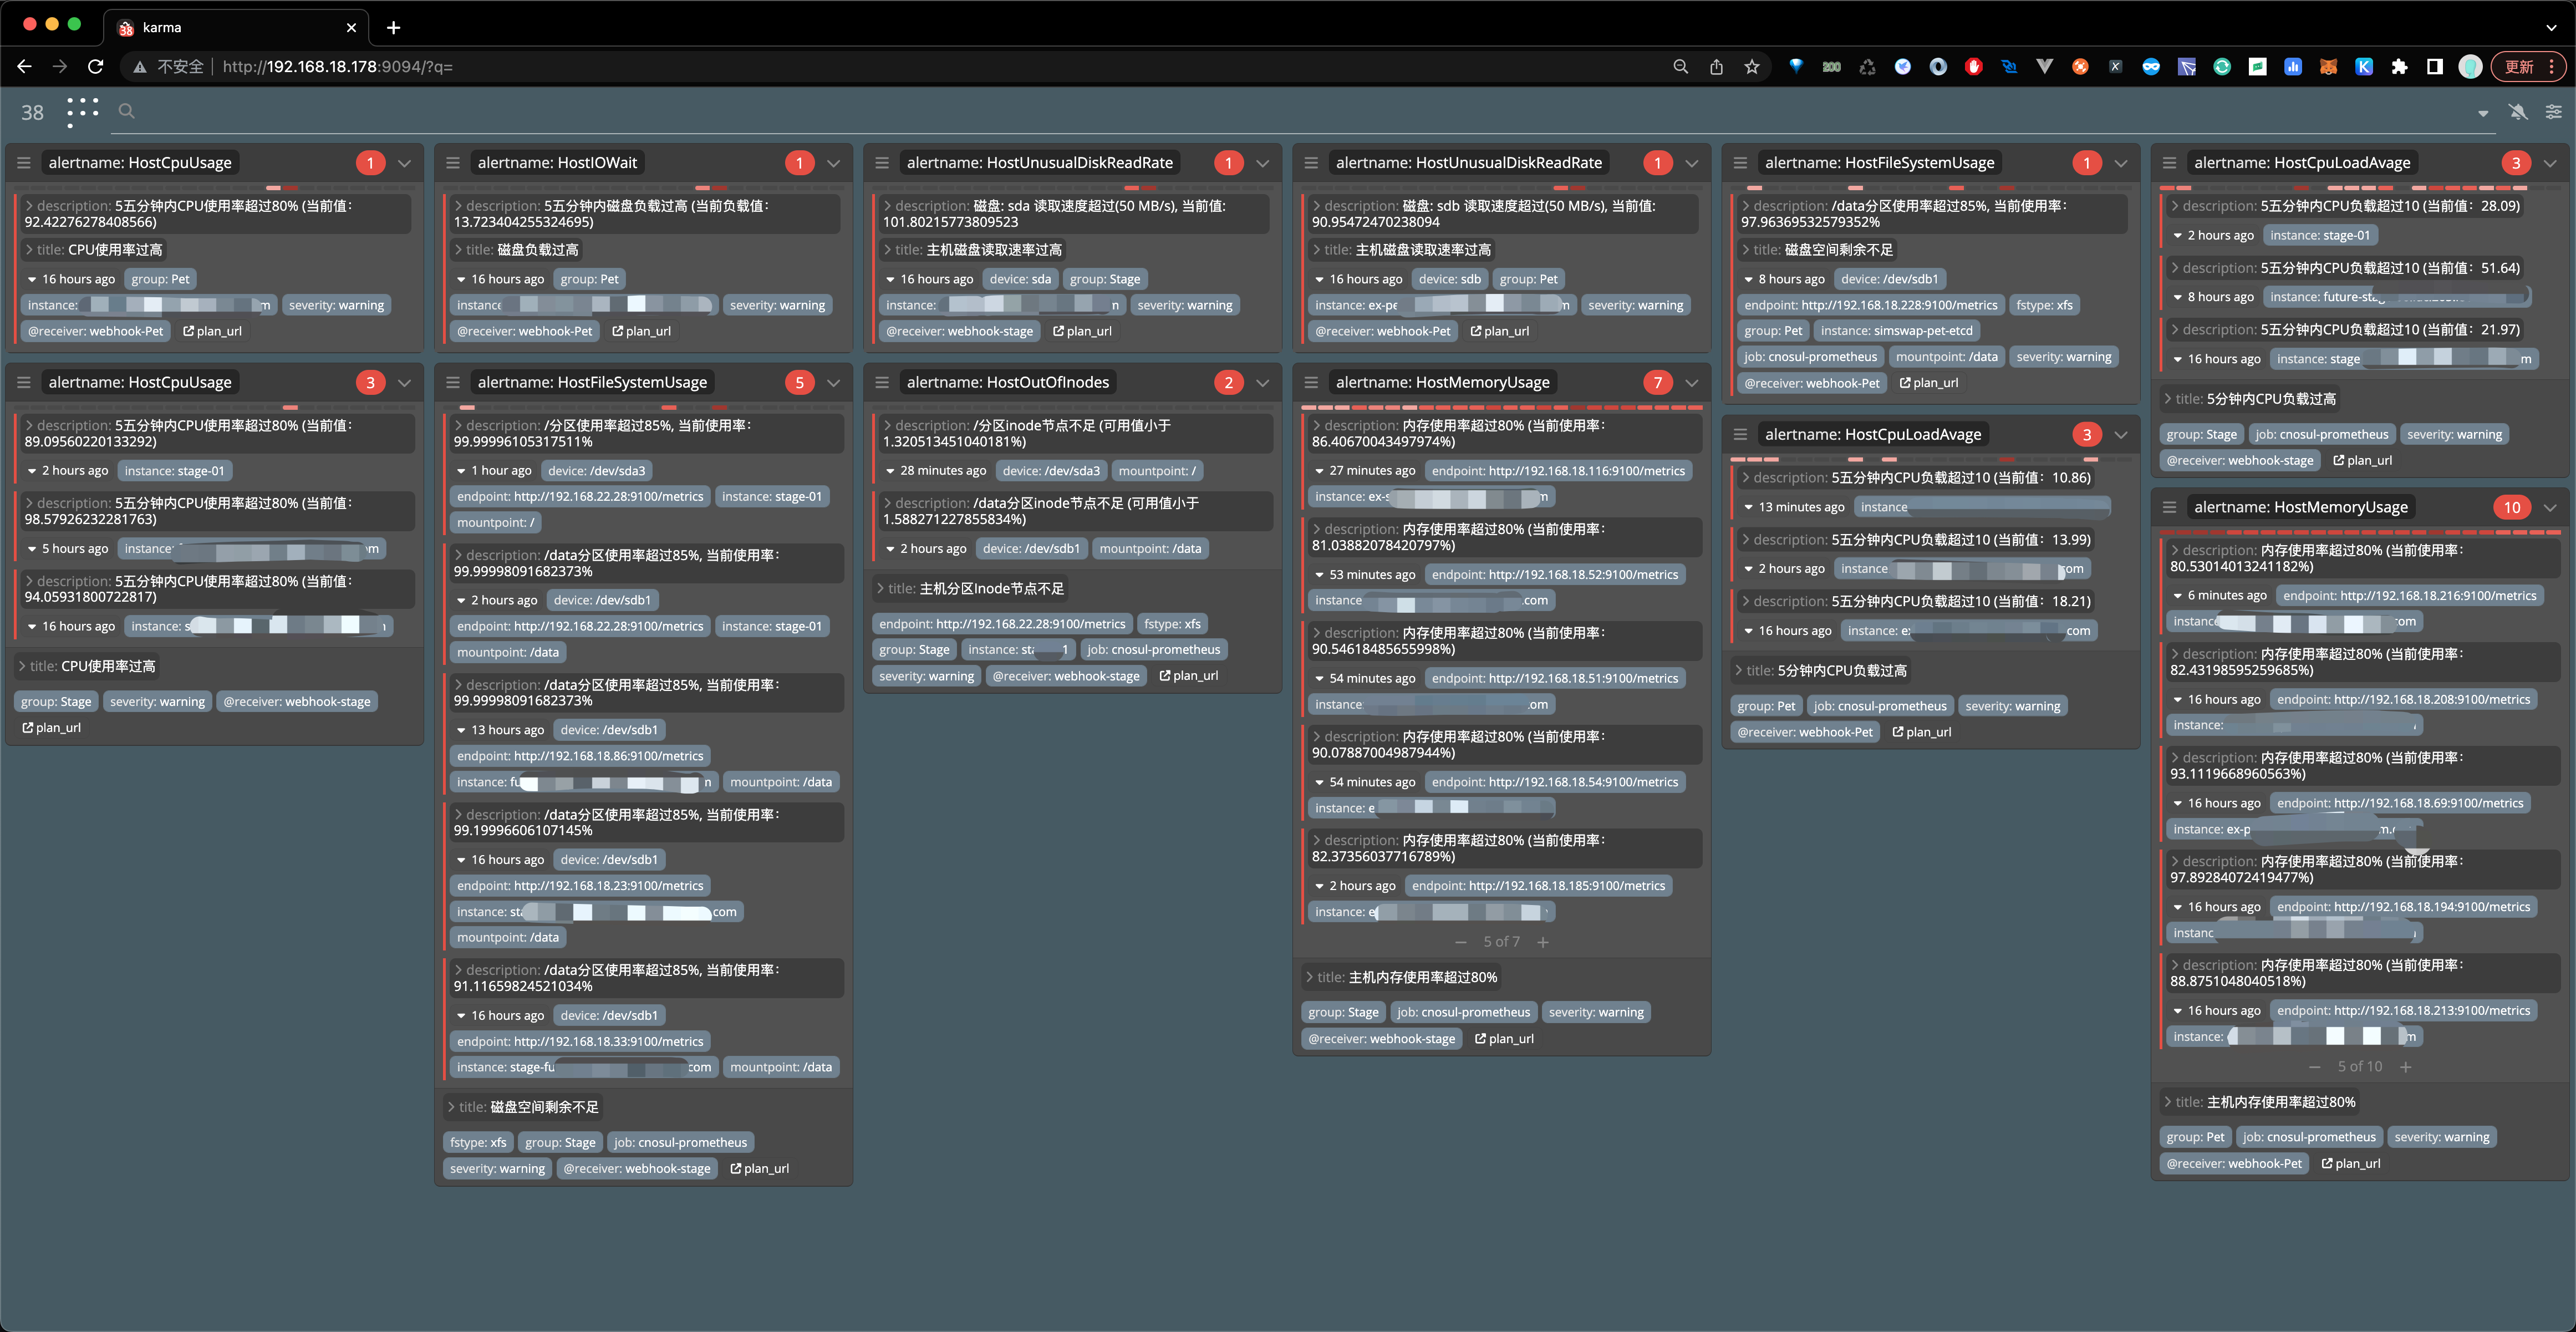
另外在部署prometheus 我们还部署了一个容器上是github上有人开源了一个接入alertmanager api 的方式获取报警内容并进行展示。比起alertmanager这个组件自身的那个ui更加好用。出处:(https://github.com/prymitive/karma)
至此整个监控系统就搭建完毕,还是有比较细节的地方需要处理比如告警规则、告警频率这些需要去优化。

 wechat
 alipay


